BB&T 2011 Annual Report Download - page 50
Download and view the complete annual report
Please find page 50 of the 2011 BB&T annual report below. You can navigate through the pages in the report by either clicking on the pages listed below, or by using the keyword search tool below to find specific information within the annual report.-
 1
1 -
2
-
3
-
4
-
5
-
6
-
7
-
8
-
9
-
10
-
11
-
12
-
13
-
14
-
15
-
16
-
17
-
18
-
19
-
20
-
21
-
22
-
23
-
24
-
25
-
26
-
27
-
28
-
29
-
30
-
31
-
32
-
33
-
34
-
35
-
36
-
37
-
38
-
39
-
 40
40 -
 41
41 -
 42
42 -
 43
43 -
 44
44 -
 45
45 -
 46
46 -
 47
47 -
 48
48 -
 49
49 -
 50
50 -
 51
51 -
 52
52 -
 53
53 -
 54
54 -
 55
55 -
 56
56 -
 57
57 -
 58
58 -
 59
59 -
 60
60 -
61
-
62
-
63
-
64
-
65
-
66
-
67
-
68
-
69
-
70
-
71
-
72
-
73
-
74
-
75
-
76
-
77
-
78
-
79
-
80
-
81
-
82
-
83
-
84
-
85
-
86
-
87
-
88
-
89
-
90
-
91
-
92
-
93
-
94
-
95
-
96
-
97
-
98
-
99
-
100
-
101
-
102
-
103
-
104
-
105
-
106
-
107
-
108
-
109
-
110
-
111
-
112
-
113
-
114
-
115
-
116
-
117
-
118
-
119
-
120
-
121
-
122
-
123
-
124
-
125
-
126
-
127
-
128
-
129
-
130
-
131
-
132
-
133
-
134
-
135
-
136
-
137
-
138
-
139
-
140
-
141
-
142
-
143
-
144
-
145
-
146
-
147
-
148
-
149
-
150
-
151
-
152
-
153
-
154
-
155
-
156
-
157
-
158
-
159
-
160
-
161
-
162
-
163
 |
 |

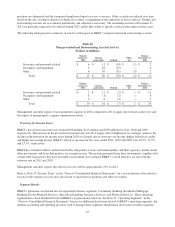
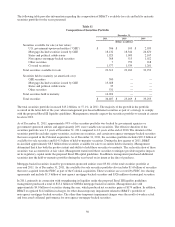
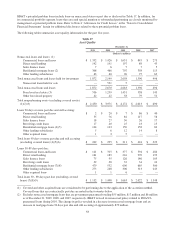
The following table provides information regarding the composition of BB&T’s available-for-sale and held to maturity
securities portfolio for the years presented:
Table 11
Composition of Securities Portfolio
December 31,
2011 2010 2009
(Dollars in millions)
Securities available for sale (at fair value):
U.S. government-sponsored entities (“GSE”) $ 306 $ 103 $ 2,035
Mortgage-backed securities issued by GSE 18,132 18,344 26,670
States and political subdivisions 1,923 1,909 2,107
Non-agency mortgage-backed securities 368 515 1,022
Other securities 7 759 218
Covered securities 1,577 1,539 1,201
Total securities available for sale 22,313 23,169 33,253
Securities held to maturity (at amortized cost):
GSE securities 500 — —
Mortgage-backed securities issued by GSE 13,028 — —
States and political subdivisions 35 — —
Other securities 531 — —
Total securities held to maturity 14,094 — —
Total securities $ 36,407 $ 23,169 $ 33,253
The total securities portfolio increased $13.2 billion, or 57.1%, in 2011. The majority of the growth in the portfolio
occurred in the latter half of the year, when management purchased additional securities as part of a strategy to comply
with the proposed Basel III liquidity guidelines. Management currently expects the securities portfolio to remain at current
levels in 2012.
As of December 31, 2011, approximately 99% of the securities portfolio was backed by government agencies or
government sponsored entities and approximately 28% were variable rate securities. The effective duration of the
securities portfolio was 3.3 years at December 31, 2011 compared to 4.0 years at the end of 2010. The duration of the
securities portfolio excludes equity securities, auction rate securities, and certain non-agency mortgage-backed securities
that were acquired in the Colonial acquisition. As of December 31, 2011, the securities portfolio includes $22.3 billion of
available-for-sale securities and $14.1 billion of held-to-maturity securities. During the first quarter of 2011, BB&T
reclassified approximately $8.3 billion from securities available for sale to securities held to maturity. Management
determined that it has both the positive intent and ability to hold these securities to maturity. The reclassification of these
securities was accounted for at fair value. Management transferred these securities to mitigate possible negative impacts
on its regulatory capital under the proposed Basel III capital guidelines. In addition, management purchased additional
securities into the held-to-maturity portfolio during the year based on its intent at the date of purchase.
Mortgage-backed securities issued by government-sponsored entities were 85.6% of the total securities portfolio at
year-end 2011. As of December 31, 2011, the available-for-sale securities portfolio also includes $1.6 billion of securities
that were acquired from the FDIC as part of the Colonial acquisition. These securities are covered by FDIC loss sharing
agreements and include $1.3 billion of non-agency mortgage-backed securities and $326 million of municipal securities.
In 2011, primarily in connection with strengthening its liquidity under the proposed Basel III liquidity guidelines,
management purchased a total of $13.4 billion of GNMA mortgage-backed securities. Management also sold
approximately $4.0 billion of securities during the year, which produced net securities gains of $174 million. In addition,
BB&T recognized $112 million in charges for other-than-temporary impairment related to BB&T’s portfolio of
non-agency mortgage-backed securities. The other-than-temporary impairment charges were the result of weaker actual
and forecasted collateral performance for non-agency mortgage-backed securities.
50