BB&T 2011 Annual Report Download - page 106
Download and view the complete annual report
Please find page 106 of the 2011 BB&T annual report below. You can navigate through the pages in the report by either clicking on the pages listed below, or by using the keyword search tool below to find specific information within the annual report.-
 1
1 -
2
-
3
-
4
-
5
-
6
-
7
-
8
-
9
-
10
-
11
-
12
-
13
-
14
-
15
-
16
-
17
-
18
-
19
-
20
-
21
-
22
-
23
-
24
-
25
-
26
-
27
-
28
-
29
-
30
-
31
-
32
-
33
-
34
-
35
-
36
-
37
-
38
-
39
-
40
-
41
-
42
-
43
-
44
-
45
-
46
-
47
-
48
-
49
-
50
-
51
-
52
-
53
-
54
-
55
-
56
-
57
-
58
-
59
-
60
-
61
-
62
-
63
-
64
-
65
-
66
-
67
-
68
-
69
-
70
-
71
-
72
-
73
-
74
-
75
-
76
-
77
-
78
-
79
-
80
-
81
-
82
-
83
-
84
-
85
-
86
-
87
-
88
-
89
-
90
-
91
-
92
-
93
-
94
-
95
-
 96
96 -
 97
97 -
 98
98 -
 99
99 -
 100
100 -
 101
101 -
 102
102 -
 103
103 -
 104
104 -
 105
105 -
 106
106 -
 107
107 -
 108
108 -
 109
109 -
 110
110 -
 111
111 -
 112
112 -
 113
113 -
 114
114 -
 115
115 -
 116
116 -
117
-
118
-
119
-
120
-
121
-
122
-
123
-
124
-
125
-
126
-
127
-
128
-
129
-
130
-
131
-
132
-
133
-
134
-
135
-
136
-
137
-
138
-
139
-
140
-
141
-
142
-
143
-
144
-
145
-
146
-
147
-
148
-
149
-
150
-
151
-
152
-
153
-
154
-
155
-
156
-
157
-
158
-
159
-
160
-
161
-
162
-
163
 |
 |

BB&T’s evaluation of the other debt securities with continuous unrealized losses indicated that there were no credit losses
evident. Furthermore, as of the date of the evaluation, BB&T did not intend to sell, and it was more likely than not that the
Company would not be required to sell, these debt securities before the anticipated recovery of the amortized cost basis. In
making this determination, BB&T considers its expected liquidity and capital needs, including its asset/liability
management needs, forecasts, strategies and other relevant information.
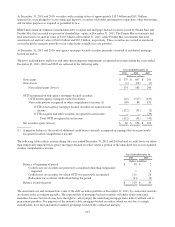
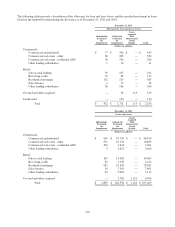
NOTE 3. Loans and Leases
The following table provides a breakdown of BB&T’s loan portfolio as of December 31, 2011 and 2010:
December 31,
2011 2010
(Dollars in millions)
Loans and leases, net of unearned income:
Commercial:
Commercial and industrial $ 36,415 $ 34,050
Commercial real estate - other 10,689 11,439
Commercial real estate - residential ADC (1) 2,061 3,397
Direct retail lending 14,467 13,749
Sales finance 7,401 7,050
Revolving credit 2,212 2,127
Residential mortgage 20,581 17,550
Other lending subsidiaries 8,737 7,953
Other acquired 39 58
Total loans and leases held for investment (excluding covered loans) 102,602 97,373
Covered 4,867 6,194
Total loans and leases held for investment 107,469 103,567
Loans held for sale 3,736 3,697
Total loans and leases $ 111,205 $ 107,264
(1) Commercial real estate - residential ADC represents residential acquisition, development and construction loans.
Unearned income and net deferred loan fees and costs totaled $374 million and $570 million at December 31, 2011 and
2010, respectively. Covered loans represent loans acquired from the FDIC subject to one of the loss sharing agreements.
Other acquired loans represent consumer loans acquired from the FDIC that are not subject to one of the loss sharing
agreements.
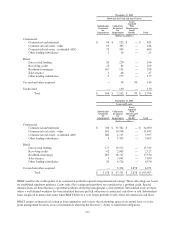
BB&T had $72.3 billion in loans secured by real estate at December 31, 2011. However, these loans were not concentrated in
any specific market or geographic area other than Branch Bank’s primary markets. Certain loans have been pledged as
collateral to the Federal Home Loan Bank (“FHLB”) and to the Federal Reserve Bank. The collateral pledged is used to
secure FHLB advances, letters of credit issued by the FHLB, and provide additional borrowing capacity.
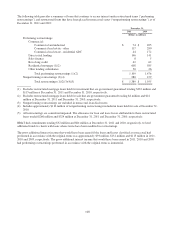
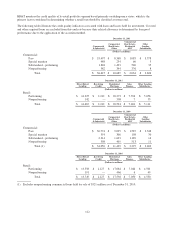
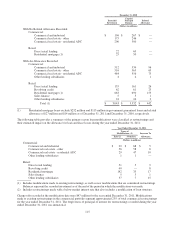
The following table reflects the carrying amount of all purchased impaired and nonimpaired loans, and the related
allowance, as of December 31, 2011 and 2010:
December 31, 2011 December 31, 2010
Purchased
Impaired
Loans
Purchased
Nonimpaired
Loans Total
Purchased
Impaired
Loans
Purchased
Nonimpaired
Loans Total
(Dollars in millions)
Residential mortgage $ 647 $ 617 $ 1,264 $ 733 $ 713 $ 1,446
Commercial real estate 1,407 1,597 3,004 2,031 1,982 4,013
Commercial 68 531 599 91 644 735
Total covered 2,122 2,745 4,867 2,855 3,339 6,194
Other acquired 2 37 39 3 55 58
Total 2,124 2,782 4,906 2,858 3,394 6,252
Allowance for loan losses (113) (36) (149) (90) (54) (144)
Net $ 2,011 $ 2,746 $ 4,757 $ 2,768 $ 3,340 $ 6,108
106