BB&T 2011 Annual Report Download - page 58
Download and view the complete annual report
Please find page 58 of the 2011 BB&T annual report below. You can navigate through the pages in the report by either clicking on the pages listed below, or by using the keyword search tool below to find specific information within the annual report.-
 1
1 -
2
-
3
-
4
-
5
-
6
-
7
-
8
-
9
-
10
-
11
-
12
-
13
-
14
-
15
-
16
-
17
-
18
-
19
-
20
-
21
-
22
-
23
-
24
-
25
-
26
-
27
-
28
-
29
-
30
-
31
-
32
-
33
-
34
-
35
-
36
-
37
-
38
-
39
-
40
-
41
-
42
-
43
-
44
-
45
-
46
-
47
-
 48
48 -
 49
49 -
 50
50 -
 51
51 -
 52
52 -
 53
53 -
 54
54 -
 55
55 -
 56
56 -
 57
57 -
 58
58 -
 59
59 -
 60
60 -
 61
61 -
 62
62 -
 63
63 -
 64
64 -
 65
65 -
 66
66 -
 67
67 -
 68
68 -
69
-
70
-
71
-
72
-
73
-
74
-
75
-
76
-
77
-
78
-
79
-
80
-
81
-
82
-
83
-
84
-
85
-
86
-
87
-
88
-
89
-
90
-
91
-
92
-
93
-
94
-
95
-
96
-
97
-
98
-
99
-
100
-
101
-
102
-
103
-
104
-
105
-
106
-
107
-
108
-
109
-
110
-
111
-
112
-
113
-
114
-
115
-
116
-
117
-
118
-
119
-
120
-
121
-
122
-
123
-
124
-
125
-
126
-
127
-
128
-
129
-
130
-
131
-
132
-
133
-
134
-
135
-
136
-
137
-
138
-
139
-
140
-
141
-
142
-
143
-
144
-
145
-
146
-
147
-
148
-
149
-
150
-
151
-
152
-
153
-
154
-
155
-
156
-
157
-
158
-
159
-
160
-
161
-
162
-
163
 |
 |

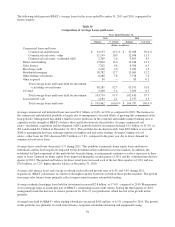
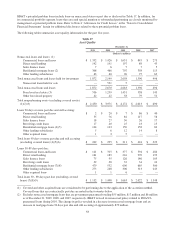
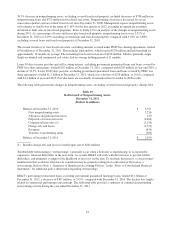
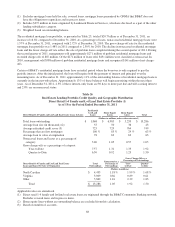
BB&T’s potential problem loans include loans on nonaccrual status or past due as disclosed in Table 17. In addition, for
its commercial portfolio segment, loans that are rated special mention or substandard performing are closely monitored by
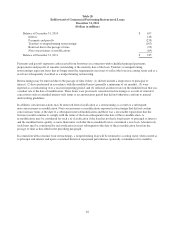
management as potential problem loans. Refer to Note 4 “Allowance for Credit Losses” in the “Notes to Consolidated
Financial Statements” herein for additional disclosures related to these potential problem loans.
The following tables summarize asset quality information for the past five years.
Table 17
Asset Quality
December 31,
2011 2010 2009 2008 2007
(Dollars in millions)
Nonaccrual loans and leases: (1)
Commercial loans and leases $ 1,352 $ 1,426 $ 1,651 $ 845 $ 273
Direct retail lending 142 191 197 89 43
Sales finance loans 76775
Residential mortgage loans (2) 308 466 707 358 113
Other lending subsidiaries 63 60 96 97 62
Total nonaccrual loans and leases held for investment 1,872 2,149 2,658 1,396 496
Nonaccrual loans held for sale — 521 5 — —
Total nonaccrual loans and leases 1,872 2,670 2,663 1,396 496
Foreclosed real estate (3) 536 1,259 1,451 538 143
Other foreclosed property 42 42 58 79 51
Total nonperforming assets (excluding covered assets)
(1)(2)(3) $ 2,450 $ 3,971 $ 4,172 $ 2,013 $ 690
Loans 90 days or more past due and still accruing:
Commercial loans and leases $ 2 $ 20 $ 7 $ 86 $ 40
Direct retail lending 55 76 82 117 58
Sales finance loans 18 27 30 26 17
Revolving credit loans 17 20 25 23 15
Residential mortgage loans (4)(5) 104 143 150 158 84
Other lending subsidiaries 5 6 12 14 8
Other acquired loans 1 3 5 — —
Total loans 90 days or more past due and still accruing
(excluding covered loans) (4)(5)(6) $ 202 $ 295 $ 311 $ 424 $ 222
Loans 30-89 days past due:
Commercial loans and leases $ 121 $ 315 $ 377 $ 594 $ 284
Direct retail lending 161 189 216 270 192
Sales finance loans 75 95 126 146 105
Revolving credit loans 22 28 32 34 24
Residential mortgage loans (7)(8) 479 532 600 665 500
Other lending subsidiaries 273 248 306 313 243
Other acquired loans 1 1 6 — —
Total loans 30 - 89 days past due (excluding covered
loans) (7)(8)(9) $ 1,132 $ 1,408 $ 1,663 $ 2,022 $ 1,348
(1) Covered and other acquired loans are considered to be performing due to the application of the accretion method.
Covered loans that are contractually past due are noted in the footnotes below.
(2) Excludes nonaccrual mortgage loans that are government guaranteed totaling $55 million, $17 million and $6 million
as of December 31, 2009, 2008, and 2007, respectively. BB&T revised its nonaccrual policy related to FHA/VA
guaranteed loans during 2010. The change in policy resulted in a decrease in nonaccrual mortgage loans and an
increase in mortgage loans 90 days past due and still accruing of approximately $79 million.
58