BB&T 2011 Annual Report Download - page 65
Download and view the complete annual report
Please find page 65 of the 2011 BB&T annual report below. You can navigate through the pages in the report by either clicking on the pages listed below, or by using the keyword search tool below to find specific information within the annual report.-
 1
1 -
2
-
3
-
4
-
5
-
6
-
7
-
8
-
9
-
10
-
11
-
12
-
13
-
14
-
15
-
16
-
17
-
18
-
19
-
20
-
21
-
22
-
23
-
24
-
25
-
26
-
27
-
28
-
29
-
30
-
31
-
32
-
33
-
34
-
35
-
36
-
37
-
38
-
39
-
40
-
41
-
42
-
43
-
44
-
45
-
46
-
47
-
48
-
49
-
50
-
51
-
52
-
53
-
54
-
 55
55 -
 56
56 -
 57
57 -
 58
58 -
 59
59 -
 60
60 -
 61
61 -
 62
62 -
 63
63 -
 64
64 -
 65
65 -
 66
66 -
 67
67 -
 68
68 -
 69
69 -
 70
70 -
 71
71 -
 72
72 -
 73
73 -
 74
74 -
 75
75 -
76
-
77
-
78
-
79
-
80
-
81
-
82
-
83
-
84
-
85
-
86
-
87
-
88
-
89
-
90
-
91
-
92
-
93
-
94
-
95
-
96
-
97
-
98
-
99
-
100
-
101
-
102
-
103
-
104
-
105
-
106
-
107
-
108
-
109
-
110
-
111
-
112
-
113
-
114
-
115
-
116
-
117
-
118
-
119
-
120
-
121
-
122
-
123
-
124
-
125
-
126
-
127
-
128
-
129
-
130
-
131
-
132
-
133
-
134
-
135
-
136
-
137
-
138
-
139
-
140
-
141
-
142
-
143
-
144
-
145
-
146
-
147
-
148
-
149
-
150
-
151
-
152
-
153
-
154
-
155
-
156
-
157
-
158
-
159
-
160
-
161
-
162
-
163
 |
 |

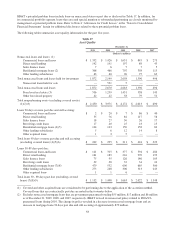
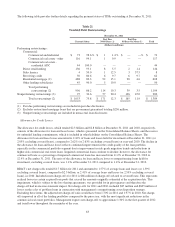
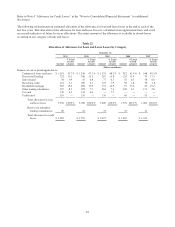
Information relevant to BB&T’s allowance for loan and lease losses for the last five years is presented in the following
table.
Table 23
Analysis of Allowance for Credit Losses
December 31,
2011 2010 2009 2008 2007
(Dollars in millions)
Allowance For Credit Losses
Beginning balance $ 2,755 $ 2,672 $ 1,607 $ 1,015 $ 888
Provision for credit losses (excluding covered loans) 1,119 2,494 2,811 1,445 448
Provision for covered loans 71 144 — — —
Charge-offs:
Commercial loans and leases (1) (898) (1,508) (720) (276) (65)
Direct retail lending (276) (338) (349) (156) (72)
Sales finance (32) (48) (72) (59) (31)
Revolving credit (95) (118) (127) (79) (47)
Residential mortgage (2) (269) (394) (280) (96) (10)
Other lending subsidiaries (190) (252) (314) (251) (180)
Covered loans (66) ————
Total charge-offs (1)(2) (1,826) (2,658) (1,862) (917) (405)
Recoveries:
Commercial loans and leases 71 37 21 16 17
Direct retail lending 37 33 19 12 13
Sales finance 99978
Revolving credit 19 16 12 11 12
Residential mortgage 5451—
Other lending subsidiaries 25 31 23 19 17
Total recoveries 166 130 89 66 67
Net charge-offs (1)(2) (1,660) (2,528) (1,773) (851) (338)
Other changes, net — (27) 27 (2) 17
Ending balance $ 2,285 $ 2,755 $ 2,672 $ 1,607 $ 1,015
Allowance For Credit Losses:
Allowance for loan and lease losses (excluding
covered loans) $ 2,107 $ 2,564 $ 2,600 $ 1,574 $ 1,004
Allowance for covered loans 149 144 — — —
Reserve for unfunded lending commitments 29 47 72 33 11
Total allowance for credit losses $ 2,285 $ 2,755 $ 2,672 $ 1,607 $ 1,015
(1) Includes charge-offs of $464 million in commercial loans and leases during 2010 in connection with BB&T’s
nonperforming loans (“NPL”) disposition strategy.
(2) Includes charge-offs of $87 million and $141 million in residential mortgage loans during 2011 and 2010,
respectively, in connection with BB&T’s NPL disposition strategy.
65