BB&T 2011 Annual Report Download - page 140
Download and view the complete annual report
Please find page 140 of the 2011 BB&T annual report below. You can navigate through the pages in the report by either clicking on the pages listed below, or by using the keyword search tool below to find specific information within the annual report.-
 1
1 -
2
-
3
-
4
-
5
-
6
-
7
-
8
-
9
-
10
-
11
-
12
-
13
-
14
-
15
-
16
-
17
-
18
-
19
-
20
-
21
-
22
-
23
-
24
-
25
-
26
-
27
-
28
-
29
-
30
-
31
-
32
-
33
-
34
-
35
-
36
-
37
-
38
-
39
-
40
-
41
-
42
-
43
-
44
-
45
-
46
-
47
-
48
-
49
-
50
-
51
-
52
-
53
-
54
-
55
-
56
-
57
-
58
-
59
-
60
-
61
-
62
-
63
-
64
-
65
-
66
-
67
-
68
-
69
-
70
-
71
-
72
-
73
-
74
-
75
-
76
-
77
-
78
-
79
-
80
-
81
-
82
-
83
-
84
-
85
-
86
-
87
-
88
-
89
-
90
-
91
-
92
-
93
-
94
-
95
-
96
-
97
-
98
-
99
-
100
-
101
-
102
-
103
-
104
-
105
-
106
-
107
-
108
-
109
-
110
-
111
-
112
-
113
-
114
-
115
-
116
-
117
-
118
-
119
-
120
-
121
-
122
-
123
-
124
-
125
-
126
-
127
-
128
-
129
-
 130
130 -
 131
131 -
 132
132 -
 133
133 -
 134
134 -
 135
135 -
 136
136 -
 137
137 -
 138
138 -
 139
139 -
 140
140 -
 141
141 -
 142
142 -
 143
143 -
 144
144 -
 145
145 -
 146
146 -
 147
147 -
 148
148 -
 149
149 -
 150
150 -
151
-
152
-
153
-
154
-
155
-
156
-
157
-
158
-
159
-
160
-
161
-
162
-
163
 |
 |
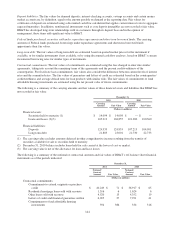
based pricing matrices that are based on observable inputs including offers, bids, reported trades, dealer quotes and market
research reports, the characteristics of a specific tranche, market convention prepayment speeds and benchmark yield
curves as described above.
States and political subdivisions: These securities are valued using market-based pricing matrices that are based on
observable inputs including MSRB reported trades, issuer spreads, material event notices and benchmark yield curves.
Non-agency mortgage-backed securities: Pricing matrices for these securities are based on observable inputs including
offers, bids, reported trades, dealer quotes and market research reports, the characteristics of a specific tranche, market
convention prepayment speeds and benchmark yield curves as described above.
Other securities: These securities consist primarily of equities, mutual funds and corporate bonds. These securities are
valued based on a review of quoted market prices for identical and similar assets as well as through the various other
inputs discussed previously.
Covered securities: Covered securities are covered by FDIC loss sharing agreements and consist of re-remic non-agency
mortgage-backed securities, municipal securities and non-agency mortgage-backed securities. The covered state and
political subdivision securities and certain non-agency mortgage-backed securities are valued in a manner similar to the
approach described above for these asset classes. The re-remic non-agency mortgage-backed securities, which are
categorized as Level 3, were valued based on broker dealer quotes that reflected certain unobservable market inputs.
Loans held for sale: BB&T originates certain mortgage loans to be sold to investors. These loans are carried at fair value
based on BB&T’s election of the Fair Value Option. The fair value is primarily based on quoted market prices for
securities backed by similar types of loans. The changes in fair value of these assets are largely driven by changes in
interest rates subsequent to loan funding and changes in the fair value of servicing associated with the mortgage loan held
for sale.
Residential mortgage servicing rights: BB&T estimates the fair value of residential mortgage servicing rights (“MSRs”)
using an option adjusted spread (“OAS”) valuation model to project MSR cash flows over multiple interest rate scenarios,
which are then discounted at risk-adjusted rates. The OAS model considers portfolio characteristics, contractually
specified servicing fees, prepayment assumptions, delinquency rates, late charges, other ancillary revenue, costs to service
and other economic factors. When available, fair value estimates and assumptions are compared to observable market data
and to recent market activity and actual portfolio experience.
Derivative assets and liabilities: BB&T uses derivatives to manage various financial risks. The fair values of derivative
financial instruments are determined based on quoted market prices, dealer quotes and internal pricing models that are
primarily sensitive to market observable data. The fair value of interest rate lock commitments, which are related to
mortgage loan commitments, is based on quoted market prices adjusted for commitments that BB&T does not expect to
fund and includes the value attributable to the net servicing fee.
Venture capital and similar investments: BB&T has venture capital and similar investments that are carried at fair value.
In many cases there are no observable market values for these investments and therefore management must estimate the
fair value based on a comparison of the operating performance of the company to multiples in the marketplace for similar
entities. This analysis requires significant judgment and actual values in a sale could differ materially from those
estimated.
Short-term borrowed funds: Short-term borrowed funds represent debt securities sold short. These are entered into
through BB&T’s brokerage subsidiary Scott & Stringfellow, LLC. These trades are executed as a hedging strategy for the
purposes of supporting institutional and retail client trading activities.
140