BB&T 2011 Annual Report Download - page 85
Download and view the complete annual report
Please find page 85 of the 2011 BB&T annual report below. You can navigate through the pages in the report by either clicking on the pages listed below, or by using the keyword search tool below to find specific information within the annual report.-
 1
1 -
2
-
3
-
4
-
5
-
6
-
7
-
8
-
9
-
10
-
11
-
12
-
13
-
14
-
15
-
16
-
17
-
18
-
19
-
20
-
21
-
22
-
23
-
24
-
25
-
26
-
27
-
28
-
29
-
30
-
31
-
32
-
33
-
34
-
35
-
36
-
37
-
38
-
39
-
40
-
41
-
42
-
43
-
44
-
45
-
46
-
47
-
48
-
49
-
50
-
51
-
52
-
53
-
54
-
55
-
56
-
57
-
58
-
59
-
60
-
61
-
62
-
63
-
64
-
65
-
66
-
67
-
68
-
69
-
70
-
71
-
72
-
73
-
74
-
 75
75 -
 76
76 -
 77
77 -
 78
78 -
 79
79 -
 80
80 -
 81
81 -
 82
82 -
 83
83 -
 84
84 -
 85
85 -
 86
86 -
 87
87 -
 88
88 -
 89
89 -
 90
90 -
 91
91 -
 92
92 -
 93
93 -
 94
94 -
 95
95 -
96
-
97
-
98
-
99
-
100
-
101
-
102
-
103
-
104
-
105
-
106
-
107
-
108
-
109
-
110
-
111
-
112
-
113
-
114
-
115
-
116
-
117
-
118
-
119
-
120
-
121
-
122
-
123
-
124
-
125
-
126
-
127
-
128
-
129
-
130
-
131
-
132
-
133
-
134
-
135
-
136
-
137
-
138
-
139
-
140
-
141
-
142
-
143
-
144
-
145
-
146
-
147
-
148
-
149
-
150
-
151
-
152
-
153
-
154
-
155
-
156
-
157
-
158
-
159
-
160
-
161
-
162
-
163
 |
 |

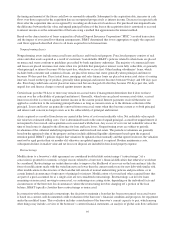
The accompanying table, “Quarterly Financial Summary—Unaudited,” presents condensed information relating to
quarterly periods in the years ended December 31, 2011 and 2010.
Table 38
Quarterly Financial Summary—Unaudited
2011 2010
Fourth
Quarter
Third
Quarter
Second
Quarter
First
Quarter
Fourth
Quarter
Third
Quarter
Second
Quarter
First
Quarter
(Dollars in millions, except per share data)
Consolidated Summary of
Operations:
Interest income $ 1,769 $ 1,750 $ 1,690 $ 1,676 $ 1,755 $ 1,762 $ 1,819 $ 1,779
Interest expense 317 334 336 391 423 448 459 465
Provision for credit losses 272 250 328 340 643 770 650 575
Securities gains (losses), net 103 (39) (2) — 99 239 219 (3)
Other noninterest income 819 729 789 714 865 871 820 847
Noninterest expense 1,618 1,417 1,395 1,372 1,421 1,408 1,500 1,341
Provision for income taxes 84 68 91 53 15 27 25 48
Net income 400 371 327 234 217 219 224 194
Noncontrolling interest 9 5 20999146
Net income available to
common shareholders $ 391 $ 366 $ 307 $ 225 $ 208 $ 210 $ 210 $ 188
Basic earnings per common
share $ 0.56 $ 0.52 $ 0.44 $ 0.32 $ 0.30 $ 0.30 $ 0.30 $ 0.27
Diluted earnings per common
share $ 0.55 $ 0.52 $ 0.44 $ 0.32 $ 0.30 $ 0.30 $ 0.30 $ 0.27
Selected Average Balances:
Assets $ 171,496 $ 165,520 $ 157,730 $ 156,931 $ 159,464 $ 155,666 $ 159,786 $ 163,807
Securities, at amortized cost 35,867 31,567 27,060 25,059 25,988 23,277 28,309 32,989
Loans and leases (1) 108,523 105,658 104,341 105,294 105,946 104,755 103,964 104,468
Total earning assets 147,364 141,259 134,235 133,331 134,929 130,983 135,374 140,138
Deposits 121,925 115,056 106,466 105,614 105,592 103,505 107,060 111,031
Federal funds purchased,
securities sold under
repurchase agreements and
short-term debt 3,727 4,307 5,486 7,286 9,446 7,355 9,105 10,207
Long-term debt 21,689 22,347 23,114 21,879 21,890 21,833 21,660 21,221
Total interest-bearing
liabilities 122,125 118,340 112,915 113,789 115,901 112,594 118,479 123,995
Shareholders’ equity 17,755 17,551 17,072 16,673 16,951 17,035 16,925 16,627
(1) Loans and leases are net of unearned income and include loans held for sale.
85