BB&T 2011 Annual Report Download - page 44
Download and view the complete annual report
Please find page 44 of the 2011 BB&T annual report below. You can navigate through the pages in the report by either clicking on the pages listed below, or by using the keyword search tool below to find specific information within the annual report.-
 1
1 -
2
-
3
-
4
-
5
-
6
-
7
-
8
-
9
-
10
-
11
-
12
-
13
-
14
-
15
-
16
-
17
-
18
-
19
-
20
-
21
-
22
-
23
-
24
-
25
-
26
-
27
-
28
-
29
-
30
-
31
-
32
-
33
-
 34
34 -
 35
35 -
 36
36 -
 37
37 -
 38
38 -
 39
39 -
 40
40 -
 41
41 -
 42
42 -
 43
43 -
 44
44 -
 45
45 -
 46
46 -
 47
47 -
 48
48 -
 49
49 -
 50
50 -
 51
51 -
 52
52 -
 53
53 -
 54
54 -
55
-
56
-
57
-
58
-
59
-
60
-
61
-
62
-
63
-
64
-
65
-
66
-
67
-
68
-
69
-
70
-
71
-
72
-
73
-
74
-
75
-
76
-
77
-
78
-
79
-
80
-
81
-
82
-
83
-
84
-
85
-
86
-
87
-
88
-
89
-
90
-
91
-
92
-
93
-
94
-
95
-
96
-
97
-
98
-
99
-
100
-
101
-
102
-
103
-
104
-
105
-
106
-
107
-
108
-
109
-
110
-
111
-
112
-
113
-
114
-
115
-
116
-
117
-
118
-
119
-
120
-
121
-
122
-
123
-
124
-
125
-
126
-
127
-
128
-
129
-
130
-
131
-
132
-
133
-
134
-
135
-
136
-
137
-
138
-
139
-
140
-
141
-
142
-
143
-
144
-
145
-
146
-
147
-
148
-
149
-
150
-
151
-
152
-
153
-
154
-
155
-
156
-
157
-
158
-
159
-
160
-
161
-
162
-
163
 |
 |
reflects management’s more aggressive efforts to liquidate properties and fewer inflows. Management expects foreclosed
property will trend lower throughout 2012, with quarterly expense averaging less than $100 million.
Net occupancy and equipment expense increased slightly in 2011 and by $29 million, or 5.0%, in 2010. The increase in
2010 was largely a result of increased rent expense related to the Colonial acquisition.
Loan processing expenses increased $26 million in 2011 compared to 2010 and $54 million during 2010 compared to
2009. The 2011 increase includes a $12 million increase for losses related to repurchase reserves on BB&T’s investor
owned servicing portfolio. The 2010 increase includes additional costs related to the Colonial acquisition and a $23
million increase for losses related to repurchase reserves on BB&T’s investor owned servicing portfolio. BB&T had $123
million, $107 million and $33 million of loan repurchases and indemnification payments in 2011, 2010, and 2009,
respectively. While these levels have increased the past two years, they remain modest compared to the industry and
trended down each quarter during 2011.
Regulatory charges increased slightly in 2011 after a decline of $19 million in 2010. The decline in 2010 was primarily
due to a special assessment of $68 million in 2009, which was offset by higher deposit insurance premiums in 2010. In
2011, the FDIC implemented a new methodology for deposit insurance, including changes required by the Dodd-Frank
Act. The new methodology changed the assessment base from deposit liabilities to tangible assets and also introduced a
new assessment framework to better assess the risk an institution poses to the deposit insurance fund. While BB&T’s asset
base grew during 2011, which would have driven higher FDIC premiums, this was largely offset by improvements in
credit quality measures.
The remaining noninterest expenses decreased a net $69 million, or 5.4%, compared to 2010, which reflected an increase
of $185 million, or 16.8%, compared to 2009. The decrease for 2011 includes lower merger-related and restructuring
charges, as 2010 included charges related to the Colonial acquisition and systems conversion. In addition, amortization of
intangibles declined by $23 million as intangibles are amortized on an accelerated basis. 2011 includes a $16 million loss
from the sale of leveraged leases and an $11 million charge for an increase to the indemnification reserve related to the
2008 sale of Visa stock. These increases were partially offset by $19 million in lower advertising and other marketing
expenses. The 2010 increase included the impact of $41 million in gains on the extinguishment of debt that were realized
during 2009. In addition, merger-related and restructuring charges and software expense increased $31 million and $23
million, respectively, from the prior year. The increase in merger-related charges was primarily due to costs incurred in
connection with the Colonial systems conversion. Advertising and other marketing expenses were also higher by $29
million compared to 2009. These increases were partially offset by a decline of $48 million in operational losses
compared to the prior year. The increase for 2010 was also impacted by the Colonial acquisition, which was completed in
August of 2009. Refer to Table 9 for additional detail on fluctuations in other categories of noninterest expense.
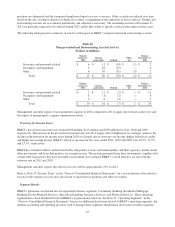
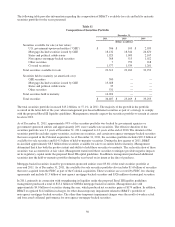
Merger-Related and Restructuring Charges
BB&T recorded certain merger-related and restructuring charges during the years 2011, 2010 and 2009. These charges are
reflected in BB&T’s Consolidated Statements of Income as a category of noninterest expense.
Merger-related and restructuring expenses or credits include: severance and personnel-related costs or credits, which
typically occur in corporate support and data processing functions; occupancy and equipment charges or credits, which
relate to costs or gains associated with lease terminations, obsolete equipment write-offs, and the sale of duplicate
facilities and equipment; and other merger-related and restructuring charges or credits, which include expenses necessary
to convert and combine the acquired branches and operations of merged companies, direct media advertising related to the
acquisitions, asset and supply inventory write-offs, investment banking advisory fees and other similar charges. During
2011, BB&T recorded $16 million of merger-related and restructuring charges. These amounts were primarily related to
management’s expense optimization efforts and the pending acquisition of BankAtlantic. During 2010, BB&T recorded
$69 million of merger-related and restructuring charges. These amounts were primarily associated with the acquisition of
Colonial and related systems conversions. The 2009 net merger-related and restructuring charges of $38 million were
primarily associated with the acquisition of Colonial.
At December 31, 2011 and 2010, there were $20 million and $10 million, respectively, of merger-related and restructuring
accruals. Merger-related and restructuring accruals are established when the costs are incurred or once all requirements for
a plan to dispose of certain business functions have been approved by management. In general, a major portion of accrued
costs are utilized in conjunction with or immediately following the systems conversion, when most of the duplicate
44