BB&T 2011 Annual Report Download - page 53
Download and view the complete annual report
Please find page 53 of the 2011 BB&T annual report below. You can navigate through the pages in the report by either clicking on the pages listed below, or by using the keyword search tool below to find specific information within the annual report.-
 1
1 -
2
-
3
-
4
-
5
-
6
-
7
-
8
-
9
-
10
-
11
-
12
-
13
-
14
-
15
-
16
-
17
-
18
-
19
-
20
-
21
-
22
-
23
-
24
-
25
-
26
-
27
-
28
-
29
-
30
-
31
-
32
-
33
-
34
-
35
-
36
-
37
-
38
-
39
-
40
-
41
-
42
-
 43
43 -
 44
44 -
 45
45 -
 46
46 -
 47
47 -
 48
48 -
 49
49 -
 50
50 -
 51
51 -
 52
52 -
 53
53 -
 54
54 -
 55
55 -
 56
56 -
 57
57 -
 58
58 -
 59
59 -
 60
60 -
 61
61 -
 62
62 -
 63
63 -
64
-
65
-
66
-
67
-
68
-
69
-
70
-
71
-
72
-
73
-
74
-
75
-
76
-
77
-
78
-
79
-
80
-
81
-
82
-
83
-
84
-
85
-
86
-
87
-
88
-
89
-
90
-
91
-
92
-
93
-
94
-
95
-
96
-
97
-
98
-
99
-
100
-
101
-
102
-
103
-
104
-
105
-
106
-
107
-
108
-
109
-
110
-
111
-
112
-
113
-
114
-
115
-
116
-
117
-
118
-
119
-
120
-
121
-
122
-
123
-
124
-
125
-
126
-
127
-
128
-
129
-
130
-
131
-
132
-
133
-
134
-
135
-
136
-
137
-
138
-
139
-
140
-
141
-
142
-
143
-
144
-
145
-
146
-
147
-
148
-
149
-
150
-
151
-
152
-
153
-
154
-
155
-
156
-
157
-
158
-
159
-
160
-
161
-
162
-
163
 |
 |

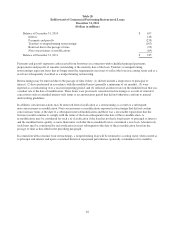
Lending Activities
The primary goal of the BB&T lending function is to help clients achieve their financial goals by providing quality loan
products that are fair to the client and profitable to the Corporation. Management believes that this purpose can best be
accomplished by building strong, profitable client relationships over time, with BB&T becoming an important contributor
to the prosperity and well-being of its clients. In addition to the importance placed on client knowledge and continuous
involvement with clients, BB&T’s lending process incorporates the standards of a consistent company-wide credit culture
and an in-depth local market knowledge. Furthermore, the Corporation employs strict underwriting criteria governing the
degree of assumed risk and the diversity of the loan portfolio in terms of type, industry and geographical concentration. In
this context, BB&T strives to meet the credit needs of businesses and consumers in its markets while pursuing a balanced
strategy of loan profitability, loan growth and loan quality.
BB&T’s loan portfolio is approximately 50% commercial and 50% retail by design, and is divided into six major
categories—commercial, direct retail, sales finance, revolving credit, residential mortgage and other lending subsidiaries.
In addition, BB&T has a portfolio of loans that were acquired in the Colonial acquisition that are covered by FDIC loss
sharing agreements. BB&T lends to a diverse customer base that is substantially located within the Corporation’s primary
market area. At the same time, the loan portfolio is geographically dispersed throughout BB&T’s branch network to
mitigate concentration risk arising from local and regional economic downturns. Refer to the “Risk Management” section
herein for a discussion of each of the loan portfolios and the credit risk management policies used to manage the
portfolios.
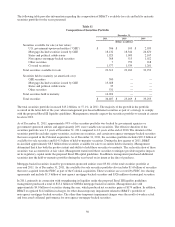
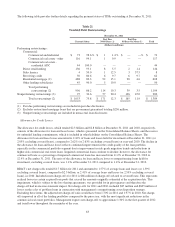
The following table summarizes BB&T’s loan portfolio based on the regulatory classification of the portfolio, which
focuses on the underlying loan collateral, and differs from internal classifications presented herein that focus on the
primary purpose of the loan. Covered loans are included in their respective categories.
Table 13
Composition of Loan and Lease Portfolio
December 31,
2011 2010 2009 2008 2007
(Dollars in millions)
Commercial, financial and agricultural
loans $ 21,452 $ 20,490 $ 19,076 $ 17,489 $ 14,515
Lease receivables 1,067 1,158 1,092 1,315 1,651
Real estate-construction and land
development loans 7,714 10,969 15,353 18,012 19,474
Real estate-mortgage loans 60,821 57,418 55,671 48,719 44,687
Consumer loans 16,415 13,532 12,464 11,710 10,580
Total loans and leases held for
investment 107,469 103,567 103,656 97,245 90,907
Loans held for sale 3,736 3,697 2,551 1,424 779
Total loans and leases $ 111,205 $ 107,264 $ 106,207 $ 98,669 $ 91,686
53