BB&T 2011 Annual Report Download - page 43
Download and view the complete annual report
Please find page 43 of the 2011 BB&T annual report below. You can navigate through the pages in the report by either clicking on the pages listed below, or by using the keyword search tool below to find specific information within the annual report.-
 1
1 -
2
-
3
-
4
-
5
-
6
-
7
-
8
-
9
-
10
-
11
-
12
-
13
-
14
-
15
-
16
-
17
-
18
-
19
-
20
-
21
-
22
-
23
-
24
-
25
-
26
-
27
-
28
-
29
-
30
-
31
-
32
-
 33
33 -
 34
34 -
 35
35 -
 36
36 -
 37
37 -
 38
38 -
 39
39 -
 40
40 -
 41
41 -
 42
42 -
 43
43 -
 44
44 -
 45
45 -
 46
46 -
 47
47 -
 48
48 -
 49
49 -
 50
50 -
 51
51 -
 52
52 -
 53
53 -
54
-
55
-
56
-
57
-
58
-
59
-
60
-
61
-
62
-
63
-
64
-
65
-
66
-
67
-
68
-
69
-
70
-
71
-
72
-
73
-
74
-
75
-
76
-
77
-
78
-
79
-
80
-
81
-
82
-
83
-
84
-
85
-
86
-
87
-
88
-
89
-
90
-
91
-
92
-
93
-
94
-
95
-
96
-
97
-
98
-
99
-
100
-
101
-
102
-
103
-
104
-
105
-
106
-
107
-
108
-
109
-
110
-
111
-
112
-
113
-
114
-
115
-
116
-
117
-
118
-
119
-
120
-
121
-
122
-
123
-
124
-
125
-
126
-
127
-
128
-
129
-
130
-
131
-
132
-
133
-
134
-
135
-
136
-
137
-
138
-
139
-
140
-
141
-
142
-
143
-
144
-
145
-
146
-
147
-
148
-
149
-
150
-
151
-
152
-
153
-
154
-
155
-
156
-
157
-
158
-
159
-
160
-
161
-
162
-
163
 |
 |

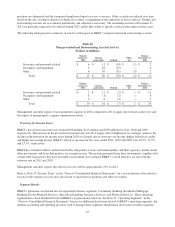
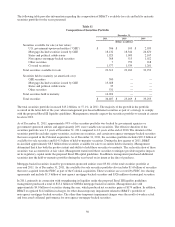
Charges.” The table below shows the components of noninterest expense and the discussion that follows explains the
composition of certain categories and the factors that caused them to change in 2011 and 2010. The increase during 2010
was impacted by the acquisition of Colonial, which occurred in August of 2009.
Table 9
Noninterest Expense
Years Ended December 31,
% Change
2011
v.
2010
2010
v.
20092011 2010 2009
(Dollars in millions)
Personnel expense:
Salaries and wages $ 2,243 $ 2,153 $ 2,000 4.2 % 7.7 %
Pension and other employee benefits 484 463 517 4.5 (10.4)
Total personnel expense 2,727 2,616 2,517 4.2 3.9
Foreclosed property expense 802 747 356 7.4 109.8
Occupancy and equipment expense:
Net occupancy expense on bank premises 394 378 366 4.2 3.3
Furniture and equipment expense 222 230 213 (3.5) 8.0
Total occupancy and equipment expense 616 608 579 1.3 5.0
Loan processing expenses 227 201 147 12.9 36.7
Regulatory charges 212 211 230 0.5 (8.3)
Professional services 174 170 130 2.4 30.8
Software expense 118 117 94 0.9 24.5
Amortization of intangibles 99 122 114 (18.9) 7.0
Merger-related and restructuring charges, net 16 69 38 (76.8) 81.6
Other expenses:
Deposit related expense 57 61 53 (6.6) 15.1
Operational losses 17 12 60 41.7 (80.0)
Miscellaneous expenses 737 736 613 0.1 20.1
Total other expenses 811 809 726 0.2 11.4
Total noninterest expense $ 5,802 $ 5,670 $ 4,931 2.3 15.0
Total personnel expense is the largest component of noninterest expense and includes salaries and wages, as well as pension
and other employee benefit costs. Total personnel expense increased 4.2% during 2011. The increase included an additional
$90 million for salaries and wages due to customary salary increases and higher incentive expense resulting from improved
performance and production-related businesses. Pension and employee benefits expense was up $21 million, largely due to
higher pension expense. Management expects pension expense to be approximately $70 million higher in 2012 due to the
change in the discount rate. Total personnel expense increased $99 million, or 3.9%, in 2010. This increase was primarily
driven by increases in salaries and wages of $153 million, which includes the impact of acquisitions. This increase was
partially offset by a $54 million decrease in pension plan expense. The decrease in pension expense was largely a result of an
increase in the value of pension assets during 2009, which resulted in an increase in the estimated return on plan assets and a
decrease in the amortization of net actuarial losses for 2010. Additional disclosures relating to BB&T’s benefit plans can be
found in Note 14 “Benefit Plans” in the “Notes to Consolidated Financial Statements.”
Foreclosed property expenses include the gain or loss on sale of foreclosed property, valuation adjustments resulting from
updated appraisals, and the ongoing expense of maintaining foreclosed properties. Foreclosed property expense increased
$55 million in 2011 and $391 million in 2010. The increase in 2011 was largely due to an increase of $78 million for
losses and write-downs, partially offset by a decrease of $23 million for maintenance and repair costs. Included in the
losses and write-downs for 2011 was a $220 million liquidity valuation adjustment in the fourth quarter related to
management’s decision to implement a more aggressive shorter period disposition strategy for foreclosed properties. The
increase of $391 million for 2010 was primarily due to higher losses and write-downs and rising maintenance costs, which
increased $331 million and $60 million, respectively. The carrying value of BB&T’s inventory of foreclosed property
decreased $723 million, or 57.4%, during 2011 and $192 million during 2010. The decline in inventory during 2011
43