BB&T 2011 Annual Report Download - page 69
Download and view the complete annual report
Please find page 69 of the 2011 BB&T annual report below. You can navigate through the pages in the report by either clicking on the pages listed below, or by using the keyword search tool below to find specific information within the annual report.-
 1
1 -
2
-
3
-
4
-
5
-
6
-
7
-
8
-
9
-
10
-
11
-
12
-
13
-
14
-
15
-
16
-
17
-
18
-
19
-
20
-
21
-
22
-
23
-
24
-
25
-
26
-
27
-
28
-
29
-
30
-
31
-
32
-
33
-
34
-
35
-
36
-
37
-
38
-
39
-
40
-
41
-
42
-
43
-
44
-
45
-
46
-
47
-
48
-
49
-
50
-
51
-
52
-
53
-
54
-
55
-
56
-
57
-
58
-
 59
59 -
 60
60 -
 61
61 -
 62
62 -
 63
63 -
 64
64 -
 65
65 -
 66
66 -
 67
67 -
 68
68 -
 69
69 -
 70
70 -
 71
71 -
 72
72 -
 73
73 -
 74
74 -
 75
75 -
 76
76 -
 77
77 -
 78
78 -
 79
79 -
80
-
81
-
82
-
83
-
84
-
85
-
86
-
87
-
88
-
89
-
90
-
91
-
92
-
93
-
94
-
95
-
96
-
97
-
98
-
99
-
100
-
101
-
102
-
103
-
104
-
105
-
106
-
107
-
108
-
109
-
110
-
111
-
112
-
113
-
114
-
115
-
116
-
117
-
118
-
119
-
120
-
121
-
122
-
123
-
124
-
125
-
126
-
127
-
128
-
129
-
130
-
131
-
132
-
133
-
134
-
135
-
136
-
137
-
138
-
139
-
140
-
141
-
142
-
143
-
144
-
145
-
146
-
147
-
148
-
149
-
150
-
151
-
152
-
153
-
154
-
155
-
156
-
157
-
158
-
159
-
160
-
161
-
162
-
163
 |
 |

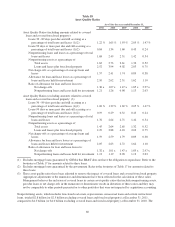
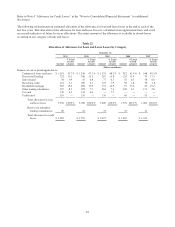
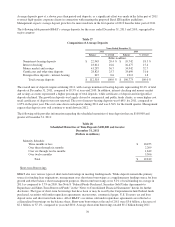
The direct retail consumer real estate loan portfolio, as presented in Table 26, totaled $13.3 billion as of December 31,
2011, a $556 million increase from December 31, 2010. This portfolio is composed of residential lot/land loans, home
equity loans and home equity lines, which are primarily originated through the Community Banking network. As a
percentage of loans, direct retail consumer real estate nonaccruals were 1.05% at December 31, 2011, compared to 1.46%
at December 31, 2010. The gross charge-off rate for the direct retail consumer real estate lending portfolio was 1.92% for
2011 compared to 2.32% for 2010. The allowance for the residential lot/land portfolio was 9.2% of the residential lot/land
portfolio as of December 31, 2011 compared to 7.3% at December 31, 2010.
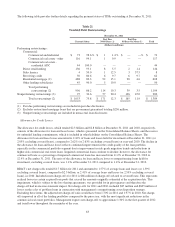
BB&T’s home equity lines generally require the payment of interest-only during the first 15 years after origination. After
this initial period, the outstanding balance begins amortizing and requires both the payment of interest and principal. As of
December 31, 2011, approximately 66% of the outstanding balance of home equity lines is currently in the interest-only
phase. Less than 5% of these balances will begin amortizing within the next three years. The delinquency rate of
interest-only lines is similar to amortizing lines.
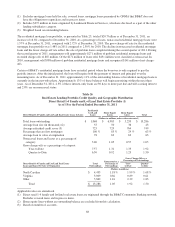
BB&T monitors the performance of its home equity loans and lines secured by second liens similar to other consumer
loans and utilizes assumptions specific to these loans in determining the necessary allowance. BB&T also receives
notification when the first lien holder, whether BB&T or another financial institution, has initiated foreclosure
proceedings against the borrower. When notified that the first lien is in the process of foreclosure, BB&T obtains
valuations to determine if any additional charge-offs or reserves are warranted. These valuations are updated at least
annually thereafter.
BB&T has limited ability to monitor the delinquency status of the first lien, unless the first lien is held or serviced by
BB&T. As a result, using migration assumptions that are based on historical experience and adjusted for current trends,
BB&T estimates the volume of second lien positions where the first lien is delinquent and appropriately adjusts the
allowance to reflect the increased risk of loss on these credits. Finally, BB&T also provides additional reserves to second
lien positions when the estimated combined current loan to value ratio for the credit exceeds 100%. As of December 31,
2011, BB&T held or serviced the first lien on 41.1% of its second lien positions.
Funding Activities
Deposits are the primary source of funds for lending and investing activities, and their cost is the largest category of
interest expense. Scheduled payments, as well as prepayments, and maturities from portfolios of loans and investment
securities also provide a stable source of funds. Federal Home Loan Bank (“FHLB”) advances, other secured borrowings,
Federal funds purchased and other short-term borrowed funds, as well as longer-term debt issued through the capital
markets, all provide supplemental liquidity sources. BB&T’s funding activities are monitored and governed through
BB&T’s overall asset/liability management process, which is further discussed in the “Market Risk Management” section
in “Management’s Discussion and Analysis of Financial Condition and Results of Operations” herein. Following is a brief
description of the various sources of funds used by BB&T.
Deposits
Deposits are attracted principally from clients within BB&T’s branch network through the offering of a broad selection of
deposit instruments to individuals and businesses, including noninterest-bearing checking accounts, interest-bearing
checking accounts, savings accounts, money market deposit accounts, certificates of deposit and individual retirement
accounts. Deposit account terms vary with respect to the minimum balance required, the time period the funds must
remain on deposit and service charge schedules. Interest rates paid on specific deposit types are determined based on
(i) the interest rates offered by competitors, (ii) the anticipated amount and timing of funding needs, (iii) the availability
and cost of alternative sources of funding, and (iv) the anticipated future economic conditions and interest rates. Deposits
are attractive sources of funding because of their stability and relative cost. Deposits are regarded as an important part of
the overall client relationship and provide opportunities to cross-sell other BB&T services.
Total deposits at December 31, 2011, were $124.9 billion, an increase of $17.7 billion, or 16.5%, compared to year-end
2010. Noninterest-bearing deposits totaled $25.7 billion at December 31, 2011, an increase of $5.0 billion, or 24.5%, from
December 31, 2010. Foreign office deposits, which are placed through BB&T’s Cayman Island office, declined $4.5
billion during 2011, as the strong deposit growth limited the need for these types of funding sources. For the year ended
December 31, 2011, total deposits averaged $112.3 billion, an increase of $5.5 billion, or 5.2%, compared to 2010.
69