BB&T 2011 Annual Report Download - page 137
Download and view the complete annual report
Please find page 137 of the 2011 BB&T annual report below. You can navigate through the pages in the report by either clicking on the pages listed below, or by using the keyword search tool below to find specific information within the annual report.-
 1
1 -
2
-
3
-
4
-
5
-
6
-
7
-
8
-
9
-
10
-
11
-
12
-
13
-
14
-
15
-
16
-
17
-
18
-
19
-
20
-
21
-
22
-
23
-
24
-
25
-
26
-
27
-
28
-
29
-
30
-
31
-
32
-
33
-
34
-
35
-
36
-
37
-
38
-
39
-
40
-
41
-
42
-
43
-
44
-
45
-
46
-
47
-
48
-
49
-
50
-
51
-
52
-
53
-
54
-
55
-
56
-
57
-
58
-
59
-
60
-
61
-
62
-
63
-
64
-
65
-
66
-
67
-
68
-
69
-
70
-
71
-
72
-
73
-
74
-
75
-
76
-
77
-
78
-
79
-
80
-
81
-
82
-
83
-
84
-
85
-
86
-
87
-
88
-
89
-
90
-
91
-
92
-
93
-
94
-
95
-
96
-
97
-
98
-
99
-
100
-
101
-
102
-
103
-
104
-
105
-
106
-
107
-
108
-
109
-
110
-
111
-
112
-
113
-
114
-
115
-
116
-
117
-
118
-
119
-
120
-
121
-
122
-
123
-
124
-
125
-
126
-
 127
127 -
 128
128 -
 129
129 -
 130
130 -
 131
131 -
 132
132 -
 133
133 -
 134
134 -
 135
135 -
 136
136 -
 137
137 -
 138
138 -
 139
139 -
 140
140 -
 141
141 -
 142
142 -
 143
143 -
 144
144 -
 145
145 -
 146
146 -
 147
147 -
148
-
149
-
150
-
151
-
152
-
153
-
154
-
155
-
156
-
157
-
158
-
159
-
160
-
161
-
162
-
163
 |
 |

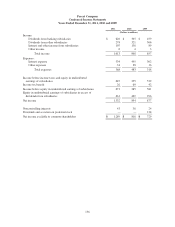
Parent Company
Condensed Statements of Cash Flows
Years Ended December 31, 2011, 2010 and 2009
2011 2010 2009
(Dollars in millions)
Cash Flows From Operating Activities:
Net income $ 1,332 $ 854 $ 877
Adjustments to reconcile net income to net cash provided by
operating activities:
Equity in earnings of subsidiaries in excess of dividends
from subsidiaries (661) (469) (296)
Decrease (increase) in other assets 63 (147) (41)
(Decrease) increase in accounts payable and accrued
liabilities (3) (24) 50
Other, net 20 (65) (11)
Net cash from operating activities 751 149 579
Cash Flows From Investing Activities:
Proceeds from sales, calls and maturities of securities available
for sale 49 87 33
Purchases of securities available for sale (48) (8) (43)
Proceeds from maturities, calls and paydowns of securities held to
maturity 24 — —
Investment in subsidiaries (12) (113) (2,608)
Advances to subsidiaries (20,306) (37,341) (61,087)
Proceeds from repayment of advances to subsidiaries 22,637 37,028 61,345
Net cash from investing activities 2,344 (347) (2,360)
Cash Flows From Financing Activities:
Net increase in long-term debt 1,121 765 3,651
Net decrease in short-term borrowed funds (509) (198) (705)
Net increase in advances from subsidiaries 69 3 —
Net proceeds from common stock issued 22 110 2,727
Retirement of preferred stock and warrant — — (3,201)
Cash dividends paid on common and preferred stock (446) (415) (820)
Net cash from financing activities 257 265 1,652
Net Increase (Decrease) in Cash and Cash Equivalents 3,352 67 (129)
Cash and Cash Equivalents at Beginning of Year 212 145 274
Cash and Cash Equivalents at End of Year $ 3,564 $ 212 $ 145
137