BB&T 2011 Annual Report Download - page 66
Download and view the complete annual report
Please find page 66 of the 2011 BB&T annual report below. You can navigate through the pages in the report by either clicking on the pages listed below, or by using the keyword search tool below to find specific information within the annual report.-
 1
1 -
2
-
3
-
4
-
5
-
6
-
7
-
8
-
9
-
10
-
11
-
12
-
13
-
14
-
15
-
16
-
17
-
18
-
19
-
20
-
21
-
22
-
23
-
24
-
25
-
26
-
27
-
28
-
29
-
30
-
31
-
32
-
33
-
34
-
35
-
36
-
37
-
38
-
39
-
40
-
41
-
42
-
43
-
44
-
45
-
46
-
47
-
48
-
49
-
50
-
51
-
52
-
53
-
54
-
55
-
 56
56 -
 57
57 -
 58
58 -
 59
59 -
 60
60 -
 61
61 -
 62
62 -
 63
63 -
 64
64 -
 65
65 -
 66
66 -
 67
67 -
 68
68 -
 69
69 -
 70
70 -
 71
71 -
 72
72 -
 73
73 -
 74
74 -
 75
75 -
 76
76 -
77
-
78
-
79
-
80
-
81
-
82
-
83
-
84
-
85
-
86
-
87
-
88
-
89
-
90
-
91
-
92
-
93
-
94
-
95
-
96
-
97
-
98
-
99
-
100
-
101
-
102
-
103
-
104
-
105
-
106
-
107
-
108
-
109
-
110
-
111
-
112
-
113
-
114
-
115
-
116
-
117
-
118
-
119
-
120
-
121
-
122
-
123
-
124
-
125
-
126
-
127
-
128
-
129
-
130
-
131
-
132
-
133
-
134
-
135
-
136
-
137
-
138
-
139
-
140
-
141
-
142
-
143
-
144
-
145
-
146
-
147
-
148
-
149
-
150
-
151
-
152
-
153
-
154
-
155
-
156
-
157
-
158
-
159
-
160
-
161
-
162
-
163
 |
 |

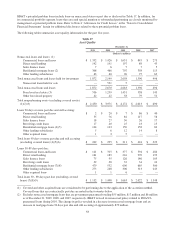
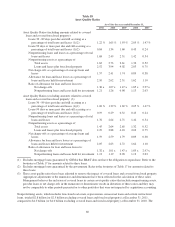
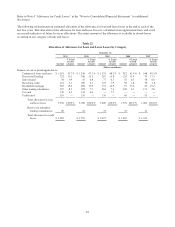
The following tables provide further details regarding BB&T’s commercial real estate lending, residential mortgage and
consumer real estate portfolios as of December 31, 2011. Geographic information has been presented for states that
exceed 10% of the category total. Consistent with BB&T’s belief that the presentation of certain asset quality measures
excluding the impact of covered loans is more meaningful, certain information reflected in the following tables has been
adjusted to exclude the impact of covered loans and foreclosed property. These adjustments have been identified and
explained in the footnotes to each table.
Table 24
Real Estate Lending Portfolio Credit Quality and Geographic Distribution
Commercial Real Estate Loan Portfolio (1) (2)
As of / For the Period Ended December 31, 2011
Commercial Real Estate - Residential ADC
Builder /
Construction
Land / Land
Development
Condos /
Townhomes Total ADC
(Dollars in millions, unless noted otherwise)
Total loans outstanding $ 551 $ 1,427 $ 83 $ 2,061
Average loan size (in thousands) 205 462 697 350
Average client size (in thousands) 531 736 1,582 679
Nonaccrual loans and leases as a percentage of
category 14.38 % 19.73 % 18.77 % 18.26 %
Gross charge-offs as a percentage of category:
Year-to-Date 7.31 12.89 5.37 11.01
Quarter-to-Date 7.58 20.17 0.93 15.93
Total
Outstandings
Nonaccrual as a
Percentage of
Outstandings
Gross Charge-Offs as a
Percentage of Outstandings
Commercial Real Estate - Residential ADC by State of
Origination Year-to-Date
Quarter-
to-Date
(Dollars in millions)
North Carolina $ 924 18.07 % 12.22 % 14.79 %
Virginia 432 11.57 2.79 4.46
Other 705 22.61 13.86 23.96
Total $ 2,061 18.26 11.01 15.93
Commercial Real Estate - Other (3)
Commercial
Construction
Commercial
Land /
Development
Permanent
Income
Producing
Properties
Total Other
Commercial Real
Estate
(Dollars in millions, unless noted otherwise)
Total loans outstanding $ 798 $ 1,033 $ 8,866 $ 10,697
Average loan size (in thousands) 917 595 513 538
Average client size (in thousands) 1,227 703 783 795
Nonaccrual loans and leases as a percentage of
category 1.90 % 9.99 % 3.11 % 3.68 %
Gross charge-offs as a percentage of category:
Year-to-Date 2.30 7.03 1.95 2.53
Quarter-to-Date 3.72 4.67 1.77 2.21
Nonaccrual as a
Percentage of
Outstandings
Gross Charge-Offs as a
Percentage of Outstandings
Commercial Real Estate - Other by State of Origination (3)
Total
Outstandings Year-to-Date
Quarter-
to-Date
(Dollars in millions)
North Carolina $ 3,261 3.55 % 1.66 % 1.00 %
Virginia 1,830 1.62 1.06 1.52
Georgia 1,570 6.21 4.60 4.35
Other 4,036 3.74 3.08 2.65
Total $ 10,697 3.68 2.53 2.21
66