BB&T 2011 Annual Report Download - page 7
Download and view the complete annual report
Please find page 7 of the 2011 BB&T annual report below. You can navigate through the pages in the report by either clicking on the pages listed below, or by using the keyword search tool below to find specific information within the annual report.-
 1
1 -
 2
2 -
 3
3 -
 4
4 -
 5
5 -
 6
6 -
 7
7 -
 8
8 -
 9
9 -
 10
10 -
 11
11 -
 12
12 -
 13
13 -
 14
14 -
 15
15 -
 16
16 -
 17
17 -
 18
18 -
19
-
20
-
21
-
22
-
23
-
24
-
25
-
26
-
27
-
28
-
29
-
30
-
31
-
32
-
33
-
34
-
35
-
36
-
37
-
38
-
39
-
40
-
41
-
42
-
43
-
44
-
45
-
46
-
47
-
48
-
49
-
50
-
51
-
52
-
53
-
54
-
55
-
56
-
57
-
58
-
59
-
60
-
61
-
62
-
63
-
64
-
65
-
66
-
67
-
68
-
69
-
70
-
71
-
72
-
73
-
74
-
75
-
76
-
77
-
78
-
79
-
80
-
81
-
82
-
83
-
84
-
85
-
86
-
87
-
88
-
89
-
90
-
91
-
92
-
93
-
94
-
95
-
96
-
97
-
98
-
99
-
100
-
101
-
102
-
103
-
104
-
105
-
106
-
107
-
108
-
109
-
110
-
111
-
112
-
113
-
114
-
115
-
116
-
117
-
118
-
119
-
120
-
121
-
122
-
123
-
124
-
125
-
126
-
127
-
128
-
129
-
130
-
131
-
132
-
133
-
134
-
135
-
136
-
137
-
138
-
139
-
140
-
141
-
142
-
143
-
144
-
145
-
146
-
147
-
148
-
149
-
150
-
151
-
152
-
153
-
154
-
155
-
156
-
157
-
158
-
159
-
160
-
161
-
162
-
163
 |
 |

Retail Services: Commercial Services:
Automobile lending Asset management
Bankcard lending Association services
Consumer finance Capital markets services
Home equity lending Commercial deposit services
Home mortgage lending Commercial finance
Insurance Commercial middle market lending
Investment brokerage services Commercial mortgage lending
Mobile/online banking Institutional trust services
Payment solutions Insurance
Retail deposit services Insurance premium finance
Sales finance International banking services
Small business lending Leasing
Wealth management/private banking Merchant services
Mortgage warehouse lending
Payment solutions
Real estate lending
Supply chain management
Venture capital
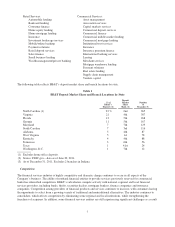
The following table reflects BB&T’s deposit market share and branch locations by state.
Table 1
BB&T Deposit Market Share and Branch Locations by State
%of
BB&T’s
Deposits (2)
Deposit
Market
Share
Rank (2)
Number
of
Branches (3)
North Carolina (1) 23 % 2nd 365
Virginia 21 4th 387
Florida 13 5th 268
Georgia 11 5th 167
Maryland 7 7th 129
South Carolina 7 3rd 116
Alabama 5 4th 87
West Virginia 5 1st 78
Kentucky 4 4th 88
Tennessee 3 6th 56
Texas 1 41st 24
Washington, D.C. 1 7th 12
(1) Excludes home office deposits.
(2) Source: FDIC.gov—data as of June 30, 2011.
(3) As of December 31, 2011. Excludes 2 branches in Indiana.
Competition
The financial services industry is highly competitive and dramatic change continues to occur in all aspects of the
Company’s business. The ability of nonbank financial entities to provide services previously reserved for commercial
banks has intensified competition. BB&T’s subsidiaries compete actively with national, regional and local financial
services providers, including banks, thrifts, securities dealers, mortgage bankers, finance companies and insurance
companies. Competition among providers of financial products and services continues to increase, with consumers having
the opportunity to select from a growing variety of traditional and nontraditional alternatives. The industry continues to
consolidate, which affects competition by eliminating some regional and local institutions, while strengthening the
franchises of acquirers. In addition, some financial services entities are still experiencing significant challenges as a result
7