BB&T 2011 Annual Report Download - page 91
Download and view the complete annual report
Please find page 91 of the 2011 BB&T annual report below. You can navigate through the pages in the report by either clicking on the pages listed below, or by using the keyword search tool below to find specific information within the annual report.-
 1
1 -
2
-
3
-
4
-
5
-
6
-
7
-
8
-
9
-
10
-
11
-
12
-
13
-
14
-
15
-
16
-
17
-
18
-
19
-
20
-
21
-
22
-
23
-
24
-
25
-
26
-
27
-
28
-
29
-
30
-
31
-
32
-
33
-
34
-
35
-
36
-
37
-
38
-
39
-
40
-
41
-
42
-
43
-
44
-
45
-
46
-
47
-
48
-
49
-
50
-
51
-
52
-
53
-
54
-
55
-
56
-
57
-
58
-
59
-
60
-
61
-
62
-
63
-
64
-
65
-
66
-
67
-
68
-
69
-
70
-
71
-
72
-
73
-
74
-
75
-
76
-
77
-
78
-
79
-
80
-
 81
81 -
 82
82 -
 83
83 -
 84
84 -
 85
85 -
 86
86 -
 87
87 -
 88
88 -
 89
89 -
 90
90 -
 91
91 -
 92
92 -
 93
93 -
 94
94 -
 95
95 -
 96
96 -
 97
97 -
 98
98 -
 99
99 -
 100
100 -
 101
101 -
102
-
103
-
104
-
105
-
106
-
107
-
108
-
109
-
110
-
111
-
112
-
113
-
114
-
115
-
116
-
117
-
118
-
119
-
120
-
121
-
122
-
123
-
124
-
125
-
126
-
127
-
128
-
129
-
130
-
131
-
132
-
133
-
134
-
135
-
136
-
137
-
138
-
139
-
140
-
141
-
142
-
143
-
144
-
145
-
146
-
147
-
148
-
149
-
150
-
151
-
152
-
153
-
154
-
155
-
156
-
157
-
158
-
159
-
160
-
161
-
162
-
163
 |
 |

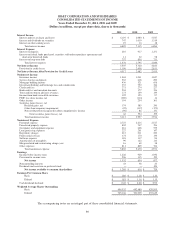
BB&T CORPORATION AND SUBSIDIARIES
CONSOLIDATED STATEMENTS OF CASH FLOWS
Years Ended December 31, 2011, 2010 and 2009
(Dollars in millions)
2011 2010 2009
Cash Flows From Operating Activities:
Net income $ 1,332 $ 854 $ 877
Adjustments to reconcile net income to net cash from operating activities:
Provision for credit losses 1,190 2,638 2,811
Depreciation 264 260 225
Amortization of intangibles 99 122 114
Equity-based compensation 98 79 62
(Gain) loss on securities, net (62) (554) (199)
Net write-downs/losses on foreclosed property 655 576 253
Net change in operating assets and liabilities:
Segregated cash due from banks 289 (39) 109
Trading securities 38 3 (260)
Loans held for sale (583) (620) (31)
FDIC loss share receivable 869 921 —
Other assets (55) (2,006) (1,058)
Accounts payable and other liabilities 572 689 (3,390)
Other, net (141) (25) (6)
Net cash from operating activities 4,565 2,898 (493)
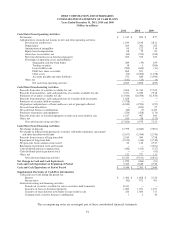
Cash Flows From Investing Activities:
Proceeds from sales of securities available for sale 4,006 31,334 17,074
Proceeds from maturities, calls and paydowns of securities available for sale 3,271 6,049 7,918
Purchases of securities available for sale (13,926) (26,598) (21,924)
Proceeds from maturities, calls and paydowns of securities held to maturity 1,828 — —
Purchases of securities held to maturity (7,578) — —
Originations and purchases of loans and leases, net of principal collected (6,240) (4,594) (392)
Net cash from divestitures — (832) 27
Net cash from business combinations (86) (7) 4,475
Purchases of premises and equipment (224) (428) (174)
Proceeds from sales of foreclosed property or other real estate held for sale 1,017 967 404
Other, net 106 88 (175)
Net cash from investing activities (17,826) 5,979 7,233
Cash Flows From Financing Activities:
Net change in deposits 17,799 (6,843) (2,901)
Net change in federal funds purchased, securities sold under repurchase agreements
and short-term borrowed funds (2,107) (2,434) (2,756)
Proceeds from issuance of long-term debt 2,010 500 3,758
Repayment of long-term debt (2,190) (336) (3,749)
Net proceeds from common stock issued 22 110 2,727
Retirement of preferred stock and warrant — — (3,201)
Cash dividends paid on common stock (446) (415) (727)
Cash dividends paid on preferred stock — — (93)
Other, net 132 277 111
Net cash from financing activities 15,220 (9,141) (6,831)
Net Change in Cash and Cash Equivalents 1,959 (264) (91)
Cash and Cash Equivalents at Beginning of Period 2,385 2,649 2,740
Cash and Cash Equivalents at End of Period $ 4,344 $ 2,385 $ 2,649
Supplemental Disclosure of Cash Flow Information:
Cash paid (received) during the period for:
Interest $ 1,404 $ 1,868 $ 2,126
Income taxes (82) 972 431
Noncash investing and financing activities:
Transfer of securities available for sale to securities held to maturity 8,341 — —
Transfers of loans to foreclosed property 1,083 1,521 1,551
Transfers of loans held for investment to loans held for sale 226 1,604 731
Common stock issued in business combinations 1 2 40
The accompanying notes are an integral part of these consolidated financial statements.
91