BB&T 2011 Annual Report Download - page 84
Download and view the complete annual report
Please find page 84 of the 2011 BB&T annual report below. You can navigate through the pages in the report by either clicking on the pages listed below, or by using the keyword search tool below to find specific information within the annual report.-
 1
1 -
2
-
3
-
4
-
5
-
6
-
7
-
8
-
9
-
10
-
11
-
12
-
13
-
14
-
15
-
16
-
17
-
18
-
19
-
20
-
21
-
22
-
23
-
24
-
25
-
26
-
27
-
28
-
29
-
30
-
31
-
32
-
33
-
34
-
35
-
36
-
37
-
38
-
39
-
40
-
41
-
42
-
43
-
44
-
45
-
46
-
47
-
48
-
49
-
50
-
51
-
52
-
53
-
54
-
55
-
56
-
57
-
58
-
59
-
60
-
61
-
62
-
63
-
64
-
65
-
66
-
67
-
68
-
69
-
70
-
71
-
72
-
73
-
 74
74 -
 75
75 -
 76
76 -
 77
77 -
 78
78 -
 79
79 -
 80
80 -
 81
81 -
 82
82 -
 83
83 -
 84
84 -
 85
85 -
 86
86 -
 87
87 -
 88
88 -
 89
89 -
 90
90 -
 91
91 -
 92
92 -
 93
93 -
 94
94 -
95
-
96
-
97
-
98
-
99
-
100
-
101
-
102
-
103
-
104
-
105
-
106
-
107
-
108
-
109
-
110
-
111
-
112
-
113
-
114
-
115
-
116
-
117
-
118
-
119
-
120
-
121
-
122
-
123
-
124
-
125
-
126
-
127
-
128
-
129
-
130
-
131
-
132
-
133
-
134
-
135
-
136
-
137
-
138
-
139
-
140
-
141
-
142
-
143
-
144
-
145
-
146
-
147
-
148
-
149
-
150
-
151
-
152
-
153
-
154
-
155
-
156
-
157
-
158
-
159
-
160
-
161
-
162
-
163
 |
 |

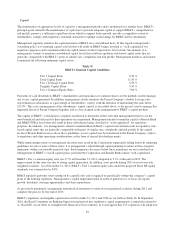
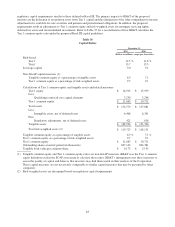
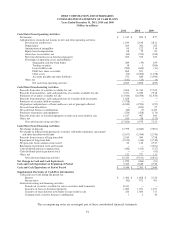
Table 37
Estimated Basel III Capital Ratios (1)
December 31,
2011
(Dollars in millions)
Tier 1 common equity under Basel I definition $ 11,663
Adjustments:
Other comprehensive income related to AFS securities, defined benefit
pension and other postretirement employee benefit plans (553)
Deduction for net defined benefit pension asset (423)
Other adjustments 57
Estimated Tier 1 common equity under Basel III definition $ 10,744
Estimated risk-weighted assets under Basel III definition $ 122,600
Estimated Tier 1 common equity as a percentage of risk-weighted assets under
Basel III definition 8.8 %
(1) The Basel III calculations are non-GAAP measures and reflect adjustments for the related elements as proposed by
regulatory authorities, which are subject to change. BB&T management uses these measures to assess the quality of
capital and believes that investors may find them useful in their analysis of the Corporation. These capital measures
are not necessarily comparable to similar capital measures that may be presented by other companies.
Fourth Quarter Results
Consolidated net income available to common shareholders for the fourth quarter of 2011 of $391 million was up 88.0%
compared to $208 million earned during the same period in 2010. On a diluted per common share basis, earnings for the
fourth quarter of 2011 were $0.55, up 83.3% compared to $0.30 for the same period in 2010. BB&T’s results of
operations for the fourth quarter of 2011 produced an annualized return on average assets of 0.93% and an annualized
return on average common shareholders’ equity of 8.76% compared to prior year ratios of 0.54% and 4.88%, respectively.
Total revenues were $2.4 billion for the fourth quarter of 2011, up $78 million compared to the fourth quarter of 2010.
The increase in total revenues was primarily due to $120 million of higher net interest income, primarily driven by lower
borrowing and deposit costs. The net interest margin was 4.02%, down 2 basis points compared to the fourth quarter of
2010. Noninterest income decreased $42 million. The decrease in noninterest income was largely attributable to a
decrease of $46 million for FDIC loss share income due to the lower offset related to the provision for covered loans and
the impact of cash flow reassessments. In addition, checkcard fees decreased $31 million primarily due to the
implementation of the Durbin amendment, and investment banking and brokerage fees decreased $22 million due to a
reduction in activity. These decreases were partially offset by $51 million of fewer losses and writedowns on the
commercial loans held for sale in connection with management’s nonperforming loan disposition strategy.
Noninterest expenses were $1.6 billion for the fourth quarter of 2011, up $197 million compared to the fourth quarter of
2010. The increase in noninterest expenses was primarily due to a $184 million increase in foreclosed property expenses
as management accelerated its strategy to reduce the inventory of foreclosed property.
The provision for credit losses, excluding covered loans, for the fourth quarter of 2011 declined $320 million, or 58.9%,
compared to the fourth quarter of 2010, as improving credit quality resulted in lower provision expense. The provision for
covered loans decreased $51 million, which was offset by a corresponding $41 million decrease in FDIC loss share
income. Net charge-offs, excluding covered loans, for the fourth quarter of 2011 were $158 million less than the fourth
quarter of 2010. The level of nonperforming assets, loan delinquencies and the outlook for future credit losses improved
significantly during 2011.
An $84 million provision for income taxes was recorded for the fourth quarter of 2011 compared to $15 million for the
fourth quarter of 2010. This resulted in an effective tax rate for the fourth quarter of 2011 of 17.4% compared to 6.5% for
the prior year’s fourth quarter. The increase in the effective tax rate was primarily due to higher levels of pre-tax earnings
in 2011 compared to 2010.
84