BB&T 2011 Annual Report Download - page 56
Download and view the complete annual report
Please find page 56 of the 2011 BB&T annual report below. You can navigate through the pages in the report by either clicking on the pages listed below, or by using the keyword search tool below to find specific information within the annual report.-
 1
1 -
2
-
3
-
4
-
5
-
6
-
7
-
8
-
9
-
10
-
11
-
12
-
13
-
14
-
15
-
16
-
17
-
18
-
19
-
20
-
21
-
22
-
23
-
24
-
25
-
26
-
27
-
28
-
29
-
30
-
31
-
32
-
33
-
34
-
35
-
36
-
37
-
38
-
39
-
40
-
41
-
42
-
43
-
44
-
45
-
 46
46 -
 47
47 -
 48
48 -
 49
49 -
 50
50 -
 51
51 -
 52
52 -
 53
53 -
 54
54 -
 55
55 -
 56
56 -
 57
57 -
 58
58 -
 59
59 -
 60
60 -
 61
61 -
 62
62 -
 63
63 -
 64
64 -
 65
65 -
 66
66 -
67
-
68
-
69
-
70
-
71
-
72
-
73
-
74
-
75
-
76
-
77
-
78
-
79
-
80
-
81
-
82
-
83
-
84
-
85
-
86
-
87
-
88
-
89
-
90
-
91
-
92
-
93
-
94
-
95
-
96
-
97
-
98
-
99
-
100
-
101
-
102
-
103
-
104
-
105
-
106
-
107
-
108
-
109
-
110
-
111
-
112
-
113
-
114
-
115
-
116
-
117
-
118
-
119
-
120
-
121
-
122
-
123
-
124
-
125
-
126
-
127
-
128
-
129
-
130
-
131
-
132
-
133
-
134
-
135
-
136
-
137
-
138
-
139
-
140
-
141
-
142
-
143
-
144
-
145
-
146
-
147
-
148
-
149
-
150
-
151
-
152
-
153
-
154
-
155
-
156
-
157
-
158
-
159
-
160
-
161
-
162
-
163
 |
 |

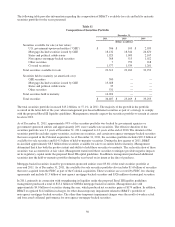
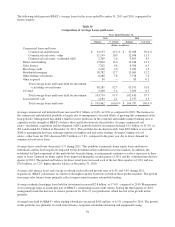
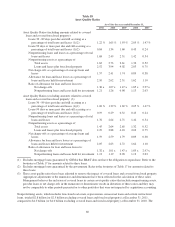
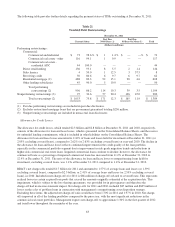
The following table presents BB&T’s average loans for the years ended December 31, 2011 and 2010, segregated by
major category:
Table 16
Composition of Average Loans and Leases
Years Ended December 31,
2011 2010
Balance % of total Balance % of total
(Dollars in millions)
Commercial loans and leases:
Commercial and industrial $ 34,153 32.3 % $ 32,028 30.6 %
Commercial real estate - other 11,139 10.5 12,056 11.5
Commercial real estate - residential ADC 2,769 2.6 4,693 4.5
Direct retail lending 13,800 13.0 13,948 13.3
Sales finance 7,202 6.8 6,766 6.5
Revolving credit 2,106 2.0 2,032 1.9
Residential mortgage 18,782 17.7 15,965 15.2
Other lending subsidiaries 8,280 7.8 7,778 7.4
Other acquired 50 — 85 0.1
Total average loans and leases held for investment
(excluding covered loans) 98,281 92.7 95,351 91.0
Covered 5,498 5.2 7,059 6.7
Total average loans and leases held for investment 103,779 97.9 102,410 97.7
Loans held for sale 2,183 2.1 2,377 2.3
Total average loans and leases $ 105,962 100.0 % $ 104,787 100.0 %
Average commercial and industrial loans increased $2.1 billion, or 6.6%, in 2011 as compared to 2010. The increase in
the commercial and industrial portfolio is largely due to management’s focused efforts at growing this component of the
loan portfolio. Management has added a number of new producers in the corporate and middle-market banking area to
capitalize on the strength of BB&T’s balance sheet and better diversify the portfolio. Average commercial real
estate - residential, acquisition and development (ADC) portfolio held for investment declined $1.9 billion, or 41.0%, in
2011 and totaled $2.1 billion at December 31, 2011. This portfolio has declined steadily from $8.0 billion at year-end
2008 as management has been reducing exposures to higher-risk real estate lending. Average Commercial real
estate – other loans for 2011 decreased $917 million, or 7.6%, compared to the prior year due to lower demand for
commercial real estate loans.
Average direct retail loans decreased 1.1% during 2011. This portfolio is primarily home equity loans and lines to
individuals and has been negatively impacted by the downturn in the residential real estate markets. In addition, the
residential lot/land component of this portfolio has been declining, as management continues to reduce exposures to these
types of loans. Demand for home equity loans improved during the second quarter of 2011 and has continued into the first
quarter of 2012. The period end balance for direct retail loans increased each of the last three quarters of 2011 and was
$718 million, or 5.2%, higher than the balance at December 31, 2010.
Average sales finance loans and average revolving credit reflected growth rates of 6.4% and 3.6% during 2011,
respectively. BB&T concentrates its efforts on the highest quality borrowers in both of these product markets. The growth
in average sales finance loans primarily reflects improvement in prime automobile lending.
Average residential mortgage loans held for investment increased $2.8 billion, or 17.6%, compared to 2010. Management
views mortgage loans as an integral part of BB&T’s relationship-based credit culture. During the third quarter of 2010,
management made the decision to retain a portion of its 10 to 15 year production, which has led to the growth in this
portfolio.
Average loans held by BB&T’s other lending subsidiaries increased $502 million, or 6.5%, compared to 2010. The growth
in this portfolio was primarily in small ticket finance, nonprime automobile financing and equipment leasing.
56