BB&T 2011 Annual Report Download - page 129
Download and view the complete annual report
Please find page 129 of the 2011 BB&T annual report below. You can navigate through the pages in the report by either clicking on the pages listed below, or by using the keyword search tool below to find specific information within the annual report.-
 1
1 -
2
-
3
-
4
-
5
-
6
-
7
-
8
-
9
-
10
-
11
-
12
-
13
-
14
-
15
-
16
-
17
-
18
-
19
-
20
-
21
-
22
-
23
-
24
-
25
-
26
-
27
-
28
-
29
-
30
-
31
-
32
-
33
-
34
-
35
-
36
-
37
-
38
-
39
-
40
-
41
-
42
-
43
-
44
-
45
-
46
-
47
-
48
-
49
-
50
-
51
-
52
-
53
-
54
-
55
-
56
-
57
-
58
-
59
-
60
-
61
-
62
-
63
-
64
-
65
-
66
-
67
-
68
-
69
-
70
-
71
-
72
-
73
-
74
-
75
-
76
-
77
-
78
-
79
-
80
-
81
-
82
-
83
-
84
-
85
-
86
-
87
-
88
-
89
-
90
-
91
-
92
-
93
-
94
-
95
-
96
-
97
-
98
-
99
-
100
-
101
-
102
-
103
-
104
-
105
-
106
-
107
-
108
-
109
-
110
-
111
-
112
-
113
-
114
-
115
-
116
-
117
-
118
-
 119
119 -
 120
120 -
 121
121 -
 122
122 -
 123
123 -
 124
124 -
 125
125 -
 126
126 -
 127
127 -
 128
128 -
 129
129 -
 130
130 -
 131
131 -
 132
132 -
 133
133 -
 134
134 -
 135
135 -
 136
136 -
 137
137 -
 138
138 -
 139
139 -
140
-
141
-
142
-
143
-
144
-
145
-
146
-
147
-
148
-
149
-
150
-
151
-
152
-
153
-
154
-
155
-
156
-
157
-
158
-
159
-
160
-
161
-
162
-
163
 |
 |

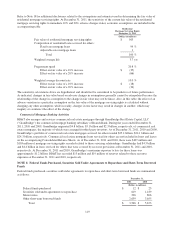
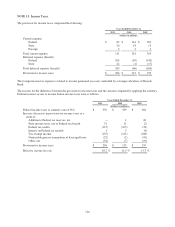
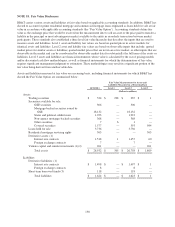
Financial data relative to the defined benefit pension plans is summarized in the following tables for the years indicated.
The qualified pension plan prepaid asset is recorded on the Consolidated Balance Sheets as a component of other assets
and the nonqualified pension plans accrued liability is recorded on the Consolidated Balance Sheets as a component of
other liabilities. The data is calculated using an actuarial measurement date of December 31.
Years Ended December 31,
2011 2010 2009
(Dollars in millions)
Net Periodic Pension Cost:
Service cost $ 105 $ 83 $ 76
Interest cost 103 93 86
Estimated return on plan assets (197) (178) (144)
Net amortization and other 34 24 58
Net periodic benefit cost 45 22 76
Pre-Tax Amounts Recognized in Comprehensive Income:
Net actuarial loss (gain) 388 133 (228)
Net amortization (34) (24) (58)
Net amount recognized in comprehensive income 354 109 (286)
Total net periodic pension costs (income) recognized in
total comprehensive income $ 399 $ 131 $ (210)
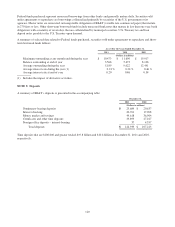
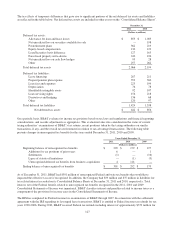
The following are the significant actuarial assumptions that were used to determine benefit obligations:
December 31,
2011 2010
Actuarial Assumptions:
Weighted average assumed discount rate 4.82 % 5.52 %
Assumed rate of annual compensation increases (1) 4.50 4.50
(1) Represents the rate to be achieved by 2015.
Qualified Pension Plan Nonqualified Pension Plans
Years Ended December 31, Years Ended December 31,
2011 2010 2011 2010
(Dollars in millions)
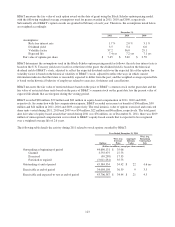
Change in Projected Benefit Obligation:
Projected benefit obligation, January 1, $ 1,696 $ 1,378 $ 182 $ 145
Service cost 99 78 6 5
Interest cost 93 84 10 9
Actuarial (gain) loss 218 203 17 31
Benefits paid (51) (47) (8) (8)
Projected benefit obligation, December 31, $ 2,055 $ 1,696 $ 207 $ 182
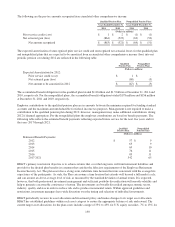
Qualified Pension Plan Nonqualified Pension Plans
Years Ended December 31, Years Ended December 31,
2011 2010 2011 2010
(Dollars in millions)
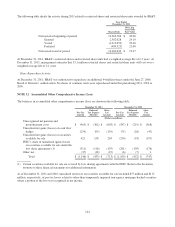
Change in Plan Assets:
Fair value of plan assets, January 1, $ 2,484 $ 2,184 $ — $ —
Actual return on plan assets 45 279 — —
Employer contributions — 68 8 8
Benefits paid (51) (47) (8) (8)
Fair value of plan assets, December 31, $ 2,478 $ 2,484 $ — $ —
Funded status at end of year $ 423 $ 788 $ (207) $ (182)
129