BB&T 2011 Annual Report Download - page 71
Download and view the complete annual report
Please find page 71 of the 2011 BB&T annual report below. You can navigate through the pages in the report by either clicking on the pages listed below, or by using the keyword search tool below to find specific information within the annual report.-
 1
1 -
2
-
3
-
4
-
5
-
6
-
7
-
8
-
9
-
10
-
11
-
12
-
13
-
14
-
15
-
16
-
17
-
18
-
19
-
20
-
21
-
22
-
23
-
24
-
25
-
26
-
27
-
28
-
29
-
30
-
31
-
32
-
33
-
34
-
35
-
36
-
37
-
38
-
39
-
40
-
41
-
42
-
43
-
44
-
45
-
46
-
47
-
48
-
49
-
50
-
51
-
52
-
53
-
54
-
55
-
56
-
57
-
58
-
59
-
60
-
 61
61 -
 62
62 -
 63
63 -
 64
64 -
 65
65 -
 66
66 -
 67
67 -
 68
68 -
 69
69 -
 70
70 -
 71
71 -
 72
72 -
 73
73 -
 74
74 -
 75
75 -
 76
76 -
 77
77 -
 78
78 -
 79
79 -
 80
80 -
 81
81 -
82
-
83
-
84
-
85
-
86
-
87
-
88
-
89
-
90
-
91
-
92
-
93
-
94
-
95
-
96
-
97
-
98
-
99
-
100
-
101
-
102
-
103
-
104
-
105
-
106
-
107
-
108
-
109
-
110
-
111
-
112
-
113
-
114
-
115
-
116
-
117
-
118
-
119
-
120
-
121
-
122
-
123
-
124
-
125
-
126
-
127
-
128
-
129
-
130
-
131
-
132
-
133
-
134
-
135
-
136
-
137
-
138
-
139
-
140
-
141
-
142
-
143
-
144
-
145
-
146
-
147
-
148
-
149
-
150
-
151
-
152
-
153
-
154
-
155
-
156
-
157
-
158
-
159
-
160
-
161
-
162
-
163
 |
 |

compared to $9.0 billion last year, a decrease of 42.5%. The decline in the balances during 2011 primarily reflects the
strong deposit growth from the Basel III liquidity initiative, which reduced the need for these types of funding sources.
The difference between the average balance and the year-end balance resulted from larger deposit growth in the latter half
of 2011.
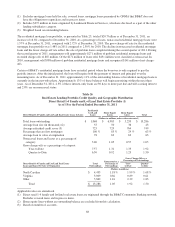
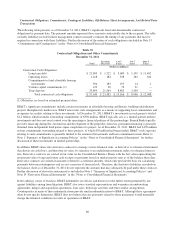
The following table summarizes certain pertinent information for the past three years with respect to BB&T’s short-term
borrowings:
Table 29
Federal Funds Purchased, Securities Sold Under
Agreements to Repurchase and Short-Term Borrowed Funds
As of / For the Years Ended December 31,
2011 2010 2009
(Dollars in millions)
Securities Sold Under Agreements to Repurchase:
Maximum outstanding at any month-end during the
year $ 1,176 $ 2,299 $ 2,635
Balance outstanding at end of year 619 1,189 2,197
Average outstanding during the year 956 1,620 2,259
Average interest rate during the year 0.73 % 0.85 % 0.96 %
Average interest rate at end of year 0.31 0.96 0.69
Federal Funds Purchased and Short-Term Borrowed Funds:
Maximum outstanding at any month-end during the
year $ 9,350 $ 10,486 $ 17,436
Balance outstanding at end of year 2,947 4,484 5,909
Average outstanding during the year 4,233 7,402 10,232
Average interest rate during the year 0.10 % 0.10 % 0.35
Average interest rate at end of year 0.17 0.32 0.21
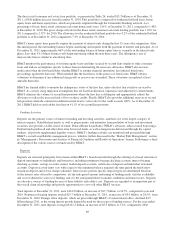
Long-term Debt
BB&T also uses long-term debt to provide both funding and, to a lesser extent, regulatory capital. Long-term debt was
13.7% of total funding on average during 2011 and 13.6% in 2010. See Note 10 “Long-Term Debt” in the “Notes to
Consolidated Financial Statements” herein for further disclosure. Long-term debt at December 31, 2011 totaled $21.8
billion. For the year ended December 31, 2011, average long-term debt increased $604 million, or 2.8%, compared to the
average for 2010.
BB&T’s long-term debt consists primarily of FHLB advances, which composed 41.3% of total outstanding long-term debt
at December 31, 2011; senior notes of BB&T Corporation, which composed 23.1% of the year-end balance; subordinated
notes of BB&T Corporation, which composed 10.8% of the year-end balance; and junior subordinated debt to
unconsolidated trusts issued by the Corporation, which composed 15.0% of total outstanding long-term debt at
December 31, 2011. The remaining long-term debt primarily consists of both unsecured senior and subordinated
borrowings by Branch Bank. FHLB advances are cost-effective long-term funding sources that provide BB&T with the
flexibility to structure the debt in a manner that aids in the management of interest rate risk and liquidity.
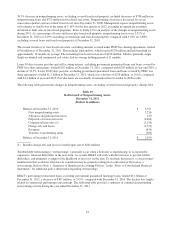
Shareholders’ Equity
Shareholders’ equity totaled $17.5 billion at December 31, 2011, an increase of $982 million, or 6.0%, from year-end
2010. BB&T’s book value per common share at December 31, 2011 was $24.98, compared to $23.67 at December 31,
2010.
Shareholders’ equity increased $836 million due to BB&T’s earnings available to common shareholders retained after
dividends declared. In addition, shareholders’ equity increased $110 million as a result of the issuance of additional shares
and other transactions in connection with BB&T’s equity-based compensation plans, 401(k) plan and dividend
reinvestment plan. Accumulated other comprehensive income increased $34 million. The increase in accumulated other
71