BB&T 2011 Annual Report Download - page 115
Download and view the complete annual report
Please find page 115 of the 2011 BB&T annual report below. You can navigate through the pages in the report by either clicking on the pages listed below, or by using the keyword search tool below to find specific information within the annual report.-
 1
1 -
2
-
3
-
4
-
5
-
6
-
7
-
8
-
9
-
10
-
11
-
12
-
13
-
14
-
15
-
16
-
17
-
18
-
19
-
20
-
21
-
22
-
23
-
24
-
25
-
26
-
27
-
28
-
29
-
30
-
31
-
32
-
33
-
34
-
35
-
36
-
37
-
38
-
39
-
40
-
41
-
42
-
43
-
44
-
45
-
46
-
47
-
48
-
49
-
50
-
51
-
52
-
53
-
54
-
55
-
56
-
57
-
58
-
59
-
60
-
61
-
62
-
63
-
64
-
65
-
66
-
67
-
68
-
69
-
70
-
71
-
72
-
73
-
74
-
75
-
76
-
77
-
78
-
79
-
80
-
81
-
82
-
83
-
84
-
85
-
86
-
87
-
88
-
89
-
90
-
91
-
92
-
93
-
94
-
95
-
96
-
97
-
98
-
99
-
100
-
101
-
102
-
103
-
104
-
 105
105 -
 106
106 -
 107
107 -
 108
108 -
 109
109 -
 110
110 -
 111
111 -
 112
112 -
 113
113 -
 114
114 -
 115
115 -
 116
116 -
 117
117 -
 118
118 -
 119
119 -
 120
120 -
 121
121 -
 122
122 -
 123
123 -
 124
124 -
 125
125 -
126
-
127
-
128
-
129
-
130
-
131
-
132
-
133
-
134
-
135
-
136
-
137
-
138
-
139
-
140
-
141
-
142
-
143
-
144
-
145
-
146
-
147
-
148
-
149
-
150
-
151
-
152
-
153
-
154
-
155
-
156
-
157
-
158
-
159
-
160
-
161
-
162
-
163
 |
 |

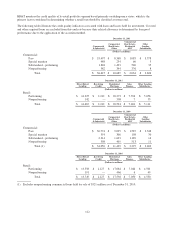
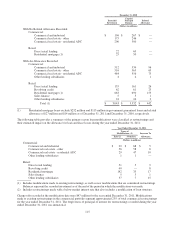
December 31, 2010
Recorded
Investment
Unpaid
Principal
Balance
Related
Allowance
(Dollars in millions)
With No Related Allowance Recorded:
Commercial:
Commercial and industrial $ 196 $ 267 $ —
Commercial real estate - other 175 246 —
Commercial real estate - residential ADC 200 300 —
Retail:
Direct retail lending 22 69 —
Residential mortgage (1) 25 50 —
With An Allowance Recorded:
Commercial:
Commercial and industrial 512 534 96
Commercial real estate - other 516 565 63
Commercial real estate - residential ADC 484 556 75
Other lending subsidiaries 4 4 1
Retail:
Direct retail lending 155 161 26
Revolving credit 62 61 25
Residential mortgage (1) 663 690 153
Sales finance 5 5 1
Other lending subsidiaries 24 24 2
Total (1) $ 3,043 $ 3,532 $ 442
(1) Residential mortgage loans exclude $232 million and $115 million in government guaranteed loans and related
allowance of $27 million and $14 million as of December 31, 2011 and December 31, 2010, respectively.
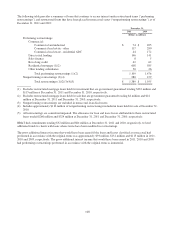
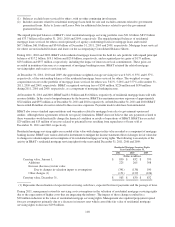
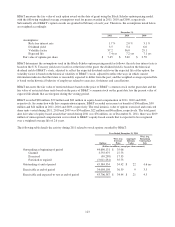
The following table provides a summary of the primary reason loan modifications were classified as restructurings and
their estimated impact on the allowance for loan and lease losses during the year ended December 31, 2011:
Year Ended December 31, 2011
Types of
Modifications (1) Increase To
Rate (2) Structure Allowance
(Dollars in millions)
Commercial:
Commercial and industrial $ 29 $ 68 $ 5
Commercial real estate - other 56 58 8
Commercial real estate - residential ADC 29 47 10
Other lending subsidiaries 1 1 —
Retail:
Direct retail lending 51 5 9
Revolving credit 40 — 8
Residential mortgage 142 35 17
Sales finance 5 5 1
Other lending subsidiaries 37 7 15
(1) Includes modifications made to existing restructurings, as well as new modifications that are considered restructurings.
Balances represent the recorded investment as of the end of the period in which the modification was made.
(2) Includes restructurings made with a below market interest rate that also includes a modification of loan structure.
Charge-offs recorded at the modification date were $47 million for the year ended December 31, 2011. Modifications
made to existing restructurings in the commercial portfolio segment approximated 25% of total commercial restructurings
for the year ended December 31, 2011. The forgiveness of principal or interest for restructurings recorded during the year
ended December 31, 2011 was immaterial.
115