BB&T 2011 Annual Report Download - page 28
Download and view the complete annual report
Please find page 28 of the 2011 BB&T annual report below. You can navigate through the pages in the report by either clicking on the pages listed below, or by using the keyword search tool below to find specific information within the annual report.-
 1
1 -
2
-
3
-
4
-
5
-
6
-
7
-
8
-
9
-
10
-
11
-
12
-
13
-
14
-
15
-
16
-
17
-
 18
18 -
 19
19 -
 20
20 -
 21
21 -
 22
22 -
 23
23 -
 24
24 -
 25
25 -
 26
26 -
 27
27 -
 28
28 -
 29
29 -
 30
30 -
 31
31 -
 32
32 -
 33
33 -
 34
34 -
 35
35 -
 36
36 -
 37
37 -
 38
38 -
39
-
40
-
41
-
42
-
43
-
44
-
45
-
46
-
47
-
48
-
49
-
50
-
51
-
52
-
53
-
54
-
55
-
56
-
57
-
58
-
59
-
60
-
61
-
62
-
63
-
64
-
65
-
66
-
67
-
68
-
69
-
70
-
71
-
72
-
73
-
74
-
75
-
76
-
77
-
78
-
79
-
80
-
81
-
82
-
83
-
84
-
85
-
86
-
87
-
88
-
89
-
90
-
91
-
92
-
93
-
94
-
95
-
96
-
97
-
98
-
99
-
100
-
101
-
102
-
103
-
104
-
105
-
106
-
107
-
108
-
109
-
110
-
111
-
112
-
113
-
114
-
115
-
116
-
117
-
118
-
119
-
120
-
121
-
122
-
123
-
124
-
125
-
126
-
127
-
128
-
129
-
130
-
131
-
132
-
133
-
134
-
135
-
136
-
137
-
138
-
139
-
140
-
141
-
142
-
143
-
144
-
145
-
146
-
147
-
148
-
149
-
150
-
151
-
152
-
153
-
154
-
155
-
156
-
157
-
158
-
159
-
160
-
161
-
162
-
163
 |
 |

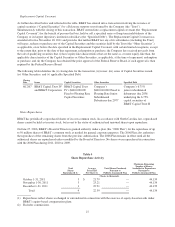
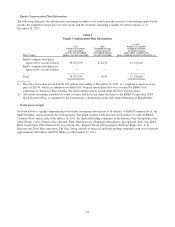
Equity Compensation Plan Information
The following table provides information concerning securities to be issued upon the exercise of outstanding equity-based
awards, the weighted average price of such awards and the securities remaining available for future issuance as of
December 31, 2011.
Table 5
Equity Compensation Plan Information
Plan Category
(a)(1)
Number of securities
to be issued upon
exercise of outstanding
options, warrants and rights
(b)(1)
Weighted-average
exercise price of
outstanding options,
warrants and rights
(c)(1)(2)
Number of securities
remaining available
for future issuance
under equity compensation
plans (excluding securities reflected in (a))
Equity compensation plans
approved by security holders 58,767,079 $ 26.54 15,178,044
Equity compensation plans not
approved by security holders — — —
Total 58,767,079 26.54 15,178,044
(1) The table above does not include 80,105 options outstanding at December 31, 2011, at a weighted-average exercise
price of $29.54, which are administered under First Virginia option plans that were assumed by BB&T in its
acquisition by merger of First Virginia. No future options will be issued under the First Virginia plans.
(2) All awards remaining available for future issuance will be issued under the terms of the BB&T Corporation 2004
Stock Incentive Plan, as amended by the Corporation’s shareholders at the 2009 Annual Meeting of Shareholders.
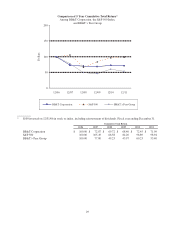
Performance Graph
Set forth below is a graph comparing the total returns (assuming reinvestment of dividends) of BB&T Common Stock, the
S&P 500 Index, and an Industry Peer Group Index. The graph assumes $100 invested on December 31, 2006 in BB&T
Common Stock and in each of the indices. In 2011, the financial holding companies in the Industry Peer Group Index (the
“Peer Group”) were Comerica Incorporated, Fifth-Third Bancorp, Huntington Bancshares, Incorporated, KeyCorp, M&T
Bank Corporation, PNC Financial Services Group, Inc., Regions Financial Corporation, SunTrust Banks, Inc., U.S.
Bancorp and Zions Bancorporation. The Peer Group consists of financial and bank holding companies with assets between
approximately $50 billion and $350 billion as of December 31, 2011.
28