BB&T 2011 Annual Report Download - page 117
Download and view the complete annual report
Please find page 117 of the 2011 BB&T annual report below. You can navigate through the pages in the report by either clicking on the pages listed below, or by using the keyword search tool below to find specific information within the annual report.-
 1
1 -
2
-
3
-
4
-
5
-
6
-
7
-
8
-
9
-
10
-
11
-
12
-
13
-
14
-
15
-
16
-
17
-
18
-
19
-
20
-
21
-
22
-
23
-
24
-
25
-
26
-
27
-
28
-
29
-
30
-
31
-
32
-
33
-
34
-
35
-
36
-
37
-
38
-
39
-
40
-
41
-
42
-
43
-
44
-
45
-
46
-
47
-
48
-
49
-
50
-
51
-
52
-
53
-
54
-
55
-
56
-
57
-
58
-
59
-
60
-
61
-
62
-
63
-
64
-
65
-
66
-
67
-
68
-
69
-
70
-
71
-
72
-
73
-
74
-
75
-
76
-
77
-
78
-
79
-
80
-
81
-
82
-
83
-
84
-
85
-
86
-
87
-
88
-
89
-
90
-
91
-
92
-
93
-
94
-
95
-
96
-
97
-
98
-
99
-
100
-
101
-
102
-
103
-
104
-
105
-
106
-
 107
107 -
 108
108 -
 109
109 -
 110
110 -
 111
111 -
 112
112 -
 113
113 -
 114
114 -
 115
115 -
 116
116 -
 117
117 -
 118
118 -
 119
119 -
 120
120 -
 121
121 -
 122
122 -
 123
123 -
 124
124 -
 125
125 -
 126
126 -
 127
127 -
128
-
129
-
130
-
131
-
132
-
133
-
134
-
135
-
136
-
137
-
138
-
139
-
140
-
141
-
142
-
143
-
144
-
145
-
146
-
147
-
148
-
149
-
150
-
151
-
152
-
153
-
154
-
155
-
156
-
157
-
158
-
159
-
160
-
161
-
162
-
163
 |
 |

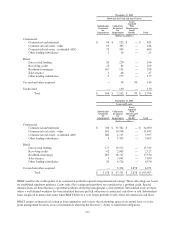
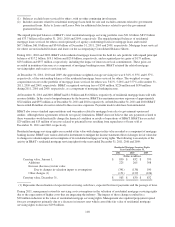
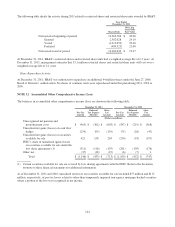
NOTE 6. Goodwill and Other Intangible Assets
The changes in the carrying amounts of goodwill attributable to each of BB&T’s operating segments for the years ended
December 31, 2011 and 2010 are reflected in the table below. To date, there have been no goodwill impairments recorded
by BB&T.
Community
Banking
Residential
Mortgage
Banking
Dealer
Financial
Services
Specialized
Lending
Insurance
Services
Financial
Services Total
(Dollars in millions)
Balance, January 1, 2010 $ 4,587 $ 7 $ 111 $ 100 $ 1,056 $ 192 $ 6,053
Contingent consideration ———— 9 — 9
Other adjustments (50) — — (6) 2 — (54)
Balance, December 31, 2010 $ 4,537 $ 7 $ 111 $ 94 $ 1,067 $ 192 $ 6,008
Acquired goodwill, net ————45 —45
Contingent consideration ————20 —20
Other adjustments 5 — — — — — 5
Balance, December 31, 2011 $ 4,542 $ 7 $ 111 $ 94 $ 1,132 $ 192 $ 6,078
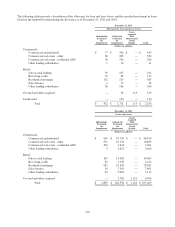
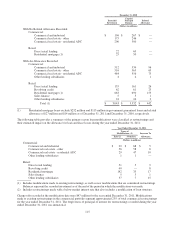
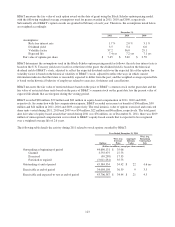
The following table presents the gross carrying amounts and accumulated amortization for BB&T’s identifiable intangible
assets subject to amortization at the dates presented:
December 31, 2011 December 31, 2010
Gross
Carrying
Amount
Accumulated
Amortization
Net
Carrying
Amount
Gross
Carrying
Amount
Accumulated
Amortization
Net
Carrying
Amount
(Dollars in millions)
Identifiable intangible assets:
Core deposit intangibles $ 626 $ (484) $ 142 $ 626 $ (438) $ 188
Other (1) 787 (485) 302 752 (432) 320
Totals $ 1,413 $ (969) $ 444 $ 1,378 $ (870) $ 508
(1) Other identifiable intangibles are primarily customer relationship intangibles.
During the years ended December 31, 2011, 2010 and 2009, BB&T incurred $99 million, $122 million and $114 million,
respectively, in pre-tax amortization expenses associated with core deposit intangibles and other intangible assets. At
December 31, 2011, the weighted-average remaining life of core deposit intangibles and other identifiable intangibles was
8.1 years and 12.6 years, respectively.
Estimated amortization expense of identifiable intangible assets for each for the next five years total $85 million, $69
million, $56 million, $46 million and $39 million.
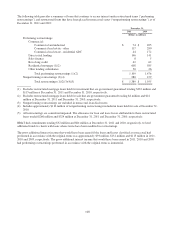
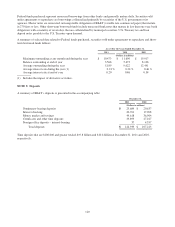
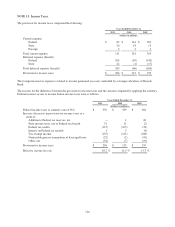
NOTE 7. Loan Servicing
Residential Mortgage Banking Activities
The following table includes a summary of residential mortgage loans managed or securitized and related delinquencies
and net charge-offs:
December 31,
2011 2010
(Dollars in millions)
Mortgage loans managed or securitized (1) $ 26,559 $ 23,692
Less: Loans securitized and transferred to securities available for sale 4 4
Loans held for sale 3,394 3,068
Covered mortgage loans 1,264 1,446
Mortgage loans sold with recourse 1,316 1,624
Mortgage loans held for investment $ 20,581 $ 17,550
Mortgage loans on nonaccrual status $ 308 $ 466
Mortgage loans 90 days or more past due and still accruing interest (2) 104 143
Mortgage loans net charge-offs 264 390
117