BB&T 2011 Annual Report Download - page 139
Download and view the complete annual report
Please find page 139 of the 2011 BB&T annual report below. You can navigate through the pages in the report by either clicking on the pages listed below, or by using the keyword search tool below to find specific information within the annual report.-
 1
1 -
2
-
3
-
4
-
5
-
6
-
7
-
8
-
9
-
10
-
11
-
12
-
13
-
14
-
15
-
16
-
17
-
18
-
19
-
20
-
21
-
22
-
23
-
24
-
25
-
26
-
27
-
28
-
29
-
30
-
31
-
32
-
33
-
34
-
35
-
36
-
37
-
38
-
39
-
40
-
41
-
42
-
43
-
44
-
45
-
46
-
47
-
48
-
49
-
50
-
51
-
52
-
53
-
54
-
55
-
56
-
57
-
58
-
59
-
60
-
61
-
62
-
63
-
64
-
65
-
66
-
67
-
68
-
69
-
70
-
71
-
72
-
73
-
74
-
75
-
76
-
77
-
78
-
79
-
80
-
81
-
82
-
83
-
84
-
85
-
86
-
87
-
88
-
89
-
90
-
91
-
92
-
93
-
94
-
95
-
96
-
97
-
98
-
99
-
100
-
101
-
102
-
103
-
104
-
105
-
106
-
107
-
108
-
109
-
110
-
111
-
112
-
113
-
114
-
115
-
116
-
117
-
118
-
119
-
120
-
121
-
122
-
123
-
124
-
125
-
126
-
127
-
128
-
 129
129 -
 130
130 -
 131
131 -
 132
132 -
 133
133 -
 134
134 -
 135
135 -
 136
136 -
 137
137 -
 138
138 -
 139
139 -
 140
140 -
 141
141 -
 142
142 -
 143
143 -
 144
144 -
 145
145 -
 146
146 -
 147
147 -
 148
148 -
 149
149 -
150
-
151
-
152
-
153
-
154
-
155
-
156
-
157
-
158
-
159
-
160
-
161
-
162
-
163
 |
 |

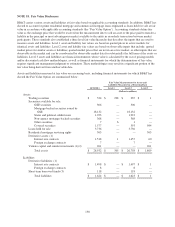
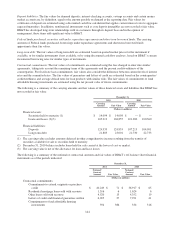
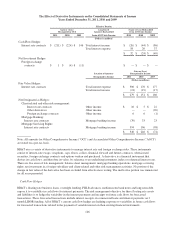
Fair Value Measurements for Assets and
Liabilities Measured on a Recurring Basis
12/31/2010 Level 1 Level 2 Level 3
(Dollars in millions)
Assets:
Trading securities $ 633 $ 276 $ 346 $ 11
Securities available for sale:
GSE securities 103 — 103 —
Mortgage-backed securities issued by GSE 18,344 — 18,344 —
States and political subdivisions 1,909 — 1,790 119
Non-agency mortgage-backed securities 515 — 515 —
Other securities 759 147 605 7
Covered securities 1,539 — 585 954
Loans held for sale (4) 3,176 — 3,176 —
Residential mortgage servicing rights 830 — — 830
Derivative assets: (1)
Interest rate contracts 926 1 913 12
Foreign exchange contracts 7 — 7 —
Venture capital and similar investments (1)(2) 266 — — 266
Total assets (4) $ 29,007 $ 424 $ 26,384 $ 2,199
Liabilities:
Derivative liabilities: (1)
Interest rate contracts $ 996 $ 10 $ 949 $ 37
Foreign exchange contracts 6 — 6 —
Short-term borrowed funds (3) 233 — 233 —
Total liabilities $ 1,235 $ 10 $ 1,188 $ 37
(1) These amounts are reflected in other assets and other liabilities on the Consolidated Balance Sheets.
(2) Based on an analysis of the nature and risks of these investments, BB&T has determined that presenting these
investments as a single class is appropriate.
(3) Short-term borrowed funds reflect securities sold short positions.
(4) Excludes loans held for sale carried at the lower of cost or market.
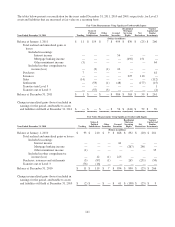
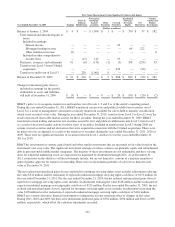
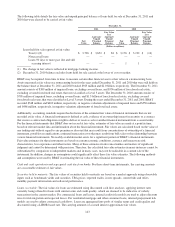
The following discussion focuses on the valuation techniques and significant inputs used by BB&T in determining the
Level 2 and Level 3 fair values of each significant class of assets and liabilities.
BB&T generally utilizes a third-party pricing service in determining the fair value of its securities portfolio. Fair value
measurements are derived from market-based pricing matrices that were developed using observable inputs that include
benchmark yields, benchmark securities, reported trades, offers, bids, issuer spreads and broker quotes. As described by
security type below, additional inputs may be used, or some inputs may not be applicable. In the event that market
observable data was not available, which would generally occur due to the lack of an active market for a given security,
the valuation of the security would be subjective and may involve substantial judgment by management.
Specific valuation techniques and inputs used in determining the fair value of each significant class of assets and liabilities
follows:
Trading securities: Trading securities are composed of all types of debt and equity securities, but the majority consists of
debt securities issued by the U.S. Treasury, U.S. government-sponsored entities, or states and political subdivisions. The
valuation techniques used for these investments are more fully discussed below.
GSE securities and Mortgage-backed securities issued by GSE: These are debt securities issued by U.S. government
sponsored entities. GSE pass-through securities are valued using market-based pricing matrices that are based on
observable inputs including benchmark TBA security pricing and yield curves that were estimated based on U.S. Treasury
yields and certain floating rate indices. The pricing matrices for these securities may also give consideration to pool-
specific data supplied directly by the GSE. GSE collateralized mortgage obligations (“CMOs”) are valued using market-
139