BB&T 2011 Annual Report Download - page 47
Download and view the complete annual report
Please find page 47 of the 2011 BB&T annual report below. You can navigate through the pages in the report by either clicking on the pages listed below, or by using the keyword search tool below to find specific information within the annual report.-
 1
1 -
2
-
3
-
4
-
5
-
6
-
7
-
8
-
9
-
10
-
11
-
12
-
13
-
14
-
15
-
16
-
17
-
18
-
19
-
20
-
21
-
22
-
23
-
24
-
25
-
26
-
27
-
28
-
29
-
30
-
31
-
32
-
33
-
34
-
35
-
36
-
 37
37 -
 38
38 -
 39
39 -
 40
40 -
 41
41 -
 42
42 -
 43
43 -
 44
44 -
 45
45 -
 46
46 -
 47
47 -
 48
48 -
 49
49 -
 50
50 -
 51
51 -
 52
52 -
 53
53 -
 54
54 -
 55
55 -
 56
56 -
 57
57 -
58
-
59
-
60
-
61
-
62
-
63
-
64
-
65
-
66
-
67
-
68
-
69
-
70
-
71
-
72
-
73
-
74
-
75
-
76
-
77
-
78
-
79
-
80
-
81
-
82
-
83
-
84
-
85
-
86
-
87
-
88
-
89
-
90
-
91
-
92
-
93
-
94
-
95
-
96
-
97
-
98
-
99
-
100
-
101
-
102
-
103
-
104
-
105
-
106
-
107
-
108
-
109
-
110
-
111
-
112
-
113
-
114
-
115
-
116
-
117
-
118
-
119
-
120
-
121
-
122
-
123
-
124
-
125
-
126
-
127
-
128
-
129
-
130
-
131
-
132
-
133
-
134
-
135
-
136
-
137
-
138
-
139
-
140
-
141
-
142
-
143
-
144
-
145
-
146
-
147
-
148
-
149
-
150
-
151
-
152
-
153
-
154
-
155
-
156
-
157
-
158
-
159
-
160
-
161
-
162
-
163
 |
 |
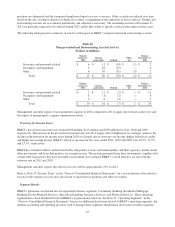
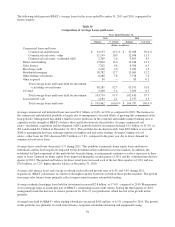
Net interest income for Residential Mortgage Banking totaled $287 million in 2011, up $27 million, or 10.4%, compared
to 2010. Net interest income in 2010 was down $83 million, or 24.2%, compared to 2009. The increase in net interest
income in 2011 was primarily due to growth in the loans held for investment, as well as higher spreads to funding costs.
The decrease in net interest income in 2010 compared to 2009 was primarily due to a higher charge for funds. Net interest
income of $343 million in 2009 was driven by loan portfolio growth, as the result of record mortgage originations, as well
as higher spreads to funding costs.
The allocated provision for loan and lease losses was $326 million for 2011, down $227 million, or 41.0%, compared to
$553 million in 2010. The decline in provision expense reflects improved credit quality in the loan portfolio. Net
charge-offs of $87 million and $141 million were recorded in 2011 and 2010, respectively, resulting from the sale of
problem loans in connection with management’s nonperforming loan disposition strategy.
Noninterest income in Residential Mortgage Banking declined $109 million, or 23.9%, to $348 million in 2011. This
decrease was due to lower mortgage loan sale volumes and margins than the prior year. Noninterest income was down
$150 million, or 24.7%, in 2010 compared to 2009. This decrease was due to lower loan production revenues compared to
a record year in 2009. Noninterest expense incurred in 2011 within Residential Mortgage Banking increased $42 million,
or 15.9%, to $306 million compared to 2010, reflecting higher foreclosed property expense, as well as an increase in
provision expense associated with loan repurchases. Noninterest expense for 2010 was up $7 million, or 2.7%, from 2009
as higher provision expense associated with loan repurchases was offset by lower incentive expense on loan originations.
Total identifiable assets of $25.5 billion for Residential Mortgage Banking increased $3.3 billion, or 14.8%. This followed
an increase in identifiable assets of $3.1 billion, or 16.3%, in 2010. Increases in identifiable assets in 2011 and 2010 were
due to management’s decision to retain a portion of 10 and 15 year mortgage production.
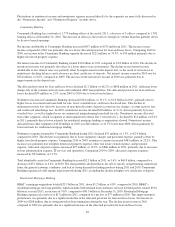
Dealer Financial Services
Net income from Dealer Financial Services was $204 million in 2011, up from $185 million in 2010. This increase is
primarily attributable to growth in average loan balances, as well as higher spreads on funding costs. Comparing 2010 to
2009, net income increased $154 million, primarily due to a lower allocated provision for loan and lease losses.
Net interest income from Dealer Financial Services increased by $61 million, or 11.9%, to $575 million in 2011 compared
to 2010. The increase in net interest income was primarily due to growth in the prime auto and marine and recreational
vehicle loan portfolios, as well as an improved net interest margin in the Regional Acceptance Corporation’s point-of-sale
loan portfolio. During 2010, net interest income increased by $61 million, or 13.5%, to $514 million compared to 2009.
This increase was due to growth in the prime marine and recreational vehicle loan portfolio, as well as the acquisition of
an indirect automobile loan portfolio in mid-2009.
The allocated provision for loan and lease losses of $125 million was up 34.4% in 2011 after a 66.1% decrease to $93
million in 2010. The increase in 2011 reflects growth in Regional Acceptance Corporation’s delinquent accounts and
nonperforming assets, which have risen from recent lows to more historical levels. The 2010 decrease reflects significant
improvements in net charge-offs over 2009 levels.
Total identifiable assets for Dealer Financial Services of $9.9 billion increased $456 million, or 4.8%, compared to 2010,
reflecting growth in lending activities following a strong prior year increase of $780 million, or 9.0%.
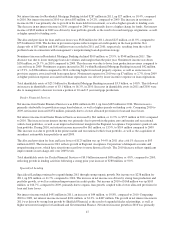
Specialized Lending
Specialized Lending continued to expand during 2011 through strong organic growth. Net income was $238 million for
2011, up $70 million, or 41.7%, compared to 2010. The increase in net income was driven by strong loan production and
portfolio growth, as well as continued improvement in credit quality. Net income in 2010 of $168 million was up $105
million, or 166.7%, compared to 2009, primarily due to organic loan growth, coupled with a lower allocated provision for
loan and lease losses.
Net interest income totaled $451 million in 2011, an increase of $44 million, or 10.8%, compared to 2010. Comparing
2010 to 2009, net interest income increased $104 million, or 34.3%, to $407 million. The growth in net interest income in
2011 was driven by strong loan growth by Sheffield Financial as the result of expanded dealer relationships, as well as
higher net interest margins for Lendmark and Governmental Finance. Net interest income growth in 2010 was primarily
47