BB&T 2011 Annual Report Download - page 48
Download and view the complete annual report
Please find page 48 of the 2011 BB&T annual report below. You can navigate through the pages in the report by either clicking on the pages listed below, or by using the keyword search tool below to find specific information within the annual report.-
 1
1 -
2
-
3
-
4
-
5
-
6
-
7
-
8
-
9
-
10
-
11
-
12
-
13
-
14
-
15
-
16
-
17
-
18
-
19
-
20
-
21
-
22
-
23
-
24
-
25
-
26
-
27
-
28
-
29
-
30
-
31
-
32
-
33
-
34
-
35
-
36
-
37
-
 38
38 -
 39
39 -
 40
40 -
 41
41 -
 42
42 -
 43
43 -
 44
44 -
 45
45 -
 46
46 -
 47
47 -
 48
48 -
 49
49 -
 50
50 -
 51
51 -
 52
52 -
 53
53 -
 54
54 -
 55
55 -
 56
56 -
 57
57 -
 58
58 -
59
-
60
-
61
-
62
-
63
-
64
-
65
-
66
-
67
-
68
-
69
-
70
-
71
-
72
-
73
-
74
-
75
-
76
-
77
-
78
-
79
-
80
-
81
-
82
-
83
-
84
-
85
-
86
-
87
-
88
-
89
-
90
-
91
-
92
-
93
-
94
-
95
-
96
-
97
-
98
-
99
-
100
-
101
-
102
-
103
-
104
-
105
-
106
-
107
-
108
-
109
-
110
-
111
-
112
-
113
-
114
-
115
-
116
-
117
-
118
-
119
-
120
-
121
-
122
-
123
-
124
-
125
-
126
-
127
-
128
-
129
-
130
-
131
-
132
-
133
-
134
-
135
-
136
-
137
-
138
-
139
-
140
-
141
-
142
-
143
-
144
-
145
-
146
-
147
-
148
-
149
-
150
-
151
-
152
-
153
-
154
-
155
-
156
-
157
-
158
-
159
-
160
-
161
-
162
-
163
 |
 |
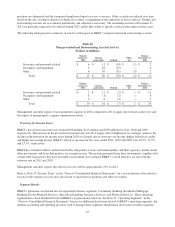
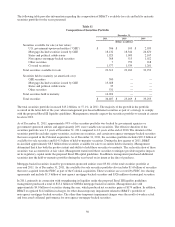
driven by growth in loans at Sheffield Financial and Governmental Finance. Average loans for Specialized Lending grew
by $1.3 billion, or 11.2%, to $12.8 billion in 2011 compared to 2010. Average loan growth for the segment was $1.4
billion, or 14.4%, in 2010 compared to 2009.
The allocated provision for loan and lease losses totaled $68 million in 2011, a decrease of $42 million, or 38.2%,
compared to 2010. Comparing 2010 to 2009, the allocated provision for loan and lease losses decreased $48 million, or
30.4%. The decline in the provision for 2011 was primarily attributable to generally improved credit performance across
the lines of business. Due to the overall higher credit risk profiles of some of Specialized Lending’s clients, loss rates are
expected to be higher than conventional bank lending. Loss rates are also affected by shifts in the portfolio mix of the
underlying subsidiaries.
Noninterest income totaled $210 million in 2011, an increase of $34 million, or 19.3%, compared to 2010. Noninterest
income growth in 2011 was driven by Grandbridge Real Estate Capital, which achieved record commercial mortgage loan
origination volume for delivery to the secondary market. Comparing 2010 to 2009, noninterest income increased $29 million,
or 19.7%. Noninterest expense totaled $265 million in 2011, an increase of $20 million, or 8.2%, compared to 2010.
The increase in noninterest expense was driven by internal growth. Comparing 2010 to 2009, noninterest expense totaled
$245 million, an increase of $20 million, or 8.9%.
Total identifiable assets of $16.8 billion for Specialized Lending increased $1.8 billion, or 12.1%, between 2010 and 2011
due primarily to organic growth in the loan portfolios of the underlying businesses. Comparing 2010 to 2009, total
identifiable assets increased $2.5 billion, or 20.0%.
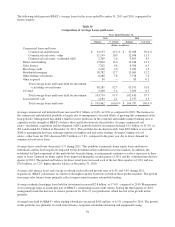
Insurance Services
Net income from Insurance Services was $104 million in 2011, essentially flat compared to 2010. Insurance Services
continues to be impacted by the weak economy and soft insurance premium pricing, resulting in low commission revenue
growth and pressure on brokerage operating margins. Comparing 2010 to 2009, net income declined $7 million, or 6.4%.
Noninterest income produced by Insurance Services totaled $1.0 billion during 2011, 2010, and 2009. Acquisitions
completed in 2011 included Precept, a full-service employee benefits consulting and administrative solutions firm with
offices in Irvine and San Ramon, California; Liberty Benefit Insurance Services, a full-service employee benefits broker
located in San Jose, California; and Atlantic Risk Management Corporation, a commercial property and casualty and
employee benefits broker located in Columbia, Maryland.
Noninterest expenses incurred within the Insurance Services segment increased $11 million, or 1.4%, in 2011 compared to
2010. This increase was due to higher operating costs, including increased legal costs compared to 2010. Comparing 2010
to 2009, noninterest expenses increased $20 million, or 2.6%.
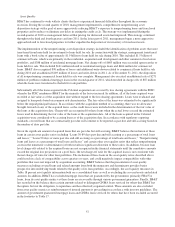
Financial Services
Net income from Financial Services increased by $57 million, or 24.4%, to $291 million in 2011. The increase from 2010
was primarily attributable to loan and deposit growth, as well as a lower allocated provision for loan and lease losses. In
2011, Financial Services experienced positive results from Corporate Banking loan and deposit growth. Comparing 2010
to 2009, net income declined $19 million, or 7.5%, to $234 million as the result of a $27 million pre-tax gain on the sale
of BB&T’s payroll processing business in 2009.
Net interest income totaled $370 million in 2011, an increase of $56 million, or 17.8%, compared to 2010. Comparing
2010 to 2009, net interest income increased $25 million, or 8.7%. The increase in net interest income during 2011 was
attributable to strong organic loan and deposit growth in Corporate Banking, offset by a lower net interest margin.
Corporate Banking was also the strongest driver in the overall increase in net interest income for 2010.
The allocated provision for loan and lease losses declined $42 million, or 93.3%, to $3 million in 2011 compared to 2010,
reflecting continued excellent credit quality performance. The allocated provision for loan and lease losses increased $12
million, or 36.4%, from 2009 to 2010 primarily due to higher loan balances.
Noninterest income in Financial Services totaled $692 million in 2011, up $35 million, or 5.3%, compared to $657 million
earned during 2010. This increase in 2011 is primarily attributable to strong BB&T Capital Partners revenue growth
related to maturing investments in its private equity and mezzanine funds. Additionally, Retirement and Institutional
48