BB&T 2011 Annual Report Download - page 148
Download and view the complete annual report
Please find page 148 of the 2011 BB&T annual report below. You can navigate through the pages in the report by either clicking on the pages listed below, or by using the keyword search tool below to find specific information within the annual report.-
 1
1 -
2
-
3
-
4
-
5
-
6
-
7
-
8
-
9
-
10
-
11
-
12
-
13
-
14
-
15
-
16
-
17
-
18
-
19
-
20
-
21
-
22
-
23
-
24
-
25
-
26
-
27
-
28
-
29
-
30
-
31
-
32
-
33
-
34
-
35
-
36
-
37
-
38
-
39
-
40
-
41
-
42
-
43
-
44
-
45
-
46
-
47
-
48
-
49
-
50
-
51
-
52
-
53
-
54
-
55
-
56
-
57
-
58
-
59
-
60
-
61
-
62
-
63
-
64
-
65
-
66
-
67
-
68
-
69
-
70
-
71
-
72
-
73
-
74
-
75
-
76
-
77
-
78
-
79
-
80
-
81
-
82
-
83
-
84
-
85
-
86
-
87
-
88
-
89
-
90
-
91
-
92
-
93
-
94
-
95
-
96
-
97
-
98
-
99
-
100
-
101
-
102
-
103
-
104
-
105
-
106
-
107
-
108
-
109
-
110
-
111
-
112
-
113
-
114
-
115
-
116
-
117
-
118
-
119
-
120
-
121
-
122
-
123
-
124
-
125
-
126
-
127
-
128
-
129
-
130
-
131
-
132
-
133
-
134
-
135
-
136
-
137
-
 138
138 -
 139
139 -
 140
140 -
 141
141 -
 142
142 -
 143
143 -
 144
144 -
 145
145 -
 146
146 -
 147
147 -
 148
148 -
 149
149 -
 150
150 -
 151
151 -
 152
152 -
 153
153 -
 154
154 -
 155
155 -
 156
156 -
 157
157 -
 158
158 -
159
-
160
-
161
-
162
-
163
 |
 |

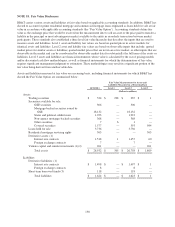
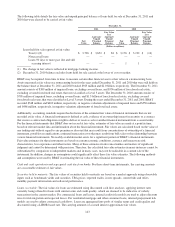
Net Investment Hedges
In connection with a long-term investment in a foreign subsidiary, BB&T is exposed to changes in the carrying value of
its investment as a result of changes in the related foreign exchange rate. At December 31, 2011 and 2010, BB&T used
derivatives to hedge the variability in the value of its $73 million investment. For net investment hedges, changes in value
of qualifying hedges are deferred in other comprehensive income (loss) when the terms of the derivative match the
notional and currency risk being hedged. At December 31, 2011 and 2010, accumulated other comprehensive income
(loss) reflected unrecognized after-tax losses totaling $11 million, related to cumulative changes in the fair value of
BB&T’s net investment hedge.
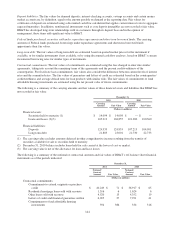
Derivatives Credit Risk
Credit risk related to derivatives arises when amounts receivable from a counterparty exceed those payable to the same
counterparty. BB&T addresses the risk of loss by subjecting counterparties to credit reviews and approvals similar to
those used in making loans or other extensions of credit and by requiring collateral. Dealer counterparties operate under
agreements to provide cash and/or liquid collateral when unsecured loss positions exceed certain negotiated limits.
As of December 31, 2011, BB&T had received cash collateral totaling $82 million related to derivatives in a gain position
totaling $80 million and had posted collateral totaling $790 million including initial margin required by exchanges related
to derivatives in a loss position totaling $730 million. As of December 31, 2010, BB&T had received cash collateral
totaling $33 million to cover derivatives in a gain position of similar value and had posted collateral totaling $605 million
related to derivatives in a loss position totaling $612 million. In the event that BB&T’s credit ratings had been
downgraded below investment grade, the amount of collateral posted would have increased by $30 million and $10
million as of December 31, 2011 and 2010, respectively.
After collateral postings are considered, BB&T had $6 million of unsecured positions in a gain with derivative dealers at
December 31, 2011 and had collateral sufficient to secure derivatives in a gain at December 31, 2010. All of the derivative
contracts to which BB&T is a party settle monthly, quarterly or semiannually. In the case of contracts with derivative
dealers, BB&T only transacts with dealers that are national market makers with strong credit ratings. Further, BB&T has
netting agreements with the dealers with which it does business. Because of these factors, BB&T’s credit risk exposure
related to derivative dealers at December 31, 2011 and 2010 was not material.
NOTE 20. Computation of Earnings Per Share
BB&T’s basic and diluted earnings per share calculations are presented in the following table:
Years Ended December 31,
2011 2010 2009
(Dollars in millions, except per share data,
shares in thousands)
Basic Earnings Per Share:
Net income available to common shareholders $ 1,289 $ 816 $ 729
Weighted average number of common shares 696,532 692,489 629,583
Basic earnings per share $ 1.85 $ 1.18 $ 1.16
Diluted Earnings Per Share:
Net income available to common shareholders $ 1,289 $ 816 $ 729
Weighted average number of common shares 696,532 692,489 629,583
Add:
Effect of dilutive outstanding equity-based awards 8,636 8,550 6,036
Weighted average number of diluted common shares 705,168 701,039 635,619
Diluted earnings per share $ 1.83 $ 1.16 $ 1.15
148