BB&T 2011 Annual Report Download - page 113
Download and view the complete annual report
Please find page 113 of the 2011 BB&T annual report below. You can navigate through the pages in the report by either clicking on the pages listed below, or by using the keyword search tool below to find specific information within the annual report.-
 1
1 -
2
-
3
-
4
-
5
-
6
-
7
-
8
-
9
-
10
-
11
-
12
-
13
-
14
-
15
-
16
-
17
-
18
-
19
-
20
-
21
-
22
-
23
-
24
-
25
-
26
-
27
-
28
-
29
-
30
-
31
-
32
-
33
-
34
-
35
-
36
-
37
-
38
-
39
-
40
-
41
-
42
-
43
-
44
-
45
-
46
-
47
-
48
-
49
-
50
-
51
-
52
-
53
-
54
-
55
-
56
-
57
-
58
-
59
-
60
-
61
-
62
-
63
-
64
-
65
-
66
-
67
-
68
-
69
-
70
-
71
-
72
-
73
-
74
-
75
-
76
-
77
-
78
-
79
-
80
-
81
-
82
-
83
-
84
-
85
-
86
-
87
-
88
-
89
-
90
-
91
-
92
-
93
-
94
-
95
-
96
-
97
-
98
-
99
-
100
-
101
-
102
-
 103
103 -
 104
104 -
 105
105 -
 106
106 -
 107
107 -
 108
108 -
 109
109 -
 110
110 -
 111
111 -
 112
112 -
 113
113 -
 114
114 -
 115
115 -
 116
116 -
 117
117 -
 118
118 -
 119
119 -
 120
120 -
 121
121 -
 122
122 -
 123
123 -
124
-
125
-
126
-
127
-
128
-
129
-
130
-
131
-
132
-
133
-
134
-
135
-
136
-
137
-
138
-
139
-
140
-
141
-
142
-
143
-
144
-
145
-
146
-
147
-
148
-
149
-
150
-
151
-
152
-
153
-
154
-
155
-
156
-
157
-
158
-
159
-
160
-
161
-
162
-
163
 |
 |

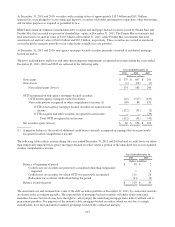
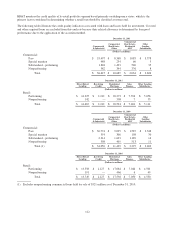
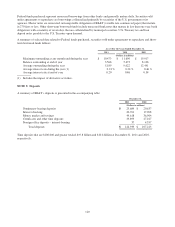
The following tables represent aging analyses of BB&T’s past due loans and leases held for investment as of
December 31, 2011 and 2010. Covered loans have been excluded from this aging analysis because they are covered by
FDIC loss sharing agreements, and their related allowance is determined by loan pool performance due to the application
of the accretion method.
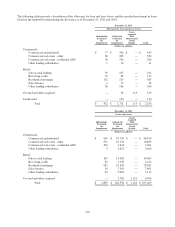
December 31, 2011
Accruing Loans and Leases
Current
30-89 Days
Past Due
90 Days Or
More Past
Due
Nonaccrual
Loans And
Leases
Total Loans And
Leases, Excluding
Covered Loans
(Dollars in millions)
Commercial:
Commercial and industrial $ 35,746 $ 85 $ 2 $ 582 $ 36,415
Commercial real estate - other 10,273 22 — 394 10,689
Commercial real estate - residential ADC 1,671 14 — 376 2,061
Other lending subsidiaries 3,589 25 4 8 3,626
Retail:
Direct retail lending 14,109 161 55 142 14,467
Revolving credit 2,173 22 17 — 2,212
Residential mortgage (2) 19,393 570 310 308 20,581
Sales finance 7,301 75 18 7 7,401
Other lending subsidiaries 4,807 248 1 55 5,111
Other acquired 37 1 1 — 39
Total (2) $ 99,099 $ 1,223 $ 408 $ 1,872 $ 102,602
December 31, 2010
Accruing Loans and Leases
Current
30-89 Days
Past Due
90 Days Or
More Past
Due
Nonaccrual
Loans And
Leases (1)
Total Loans And
Leases, Excluding
Covered Loans
(Dollars in millions)
Commercial:
Commercial and industrial $ 33,371 $ 163 $ 8 $ 508 $ 34,050
Commercial real estate - other 10,962 68 4 405 11,439
Commercial real estate - residential ADC 2,792 84 8 513 3,397
Other lending subsidiaries 3,358 29 5 11 3,403
Retail:
Direct retail lending 13,293 189 76 191 13,749
Revolving credit 2,079 28 20 — 2,127
Residential mortgage (2) 16,173 615 296 466 17,550
Sales finance 6,922 95 27 6 7,050
Other lending subsidiaries 4,281 219 1 49 4,550
Other acquired 54 1 3 — 58
Total (2) $ 93,285 $ 1,491 $ 448 $ 2,149 $ 97,373
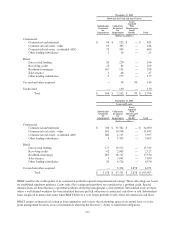
(1) Excludes nonperforming commercial loans held for sale of $521 million as of December 31, 2010.
(2) Residential mortgage loans include $91 million and $83 million in government guaranteed loans 30-89 days past due,
and $206 million and $153 million in government guaranteed loans 90 days or more past due as of December 31,
2011 and December 31, 2010, respectively.
113