BB&T 2011 Annual Report Download - page 153
Download and view the complete annual report
Please find page 153 of the 2011 BB&T annual report below. You can navigate through the pages in the report by either clicking on the pages listed below, or by using the keyword search tool below to find specific information within the annual report.-
 1
1 -
2
-
3
-
4
-
5
-
6
-
7
-
8
-
9
-
10
-
11
-
12
-
13
-
14
-
15
-
16
-
17
-
18
-
19
-
20
-
21
-
22
-
23
-
24
-
25
-
26
-
27
-
28
-
29
-
30
-
31
-
32
-
33
-
34
-
35
-
36
-
37
-
38
-
39
-
40
-
41
-
42
-
43
-
44
-
45
-
46
-
47
-
48
-
49
-
50
-
51
-
52
-
53
-
54
-
55
-
56
-
57
-
58
-
59
-
60
-
61
-
62
-
63
-
64
-
65
-
66
-
67
-
68
-
69
-
70
-
71
-
72
-
73
-
74
-
75
-
76
-
77
-
78
-
79
-
80
-
81
-
82
-
83
-
84
-
85
-
86
-
87
-
88
-
89
-
90
-
91
-
92
-
93
-
94
-
95
-
96
-
97
-
98
-
99
-
100
-
101
-
102
-
103
-
104
-
105
-
106
-
107
-
108
-
109
-
110
-
111
-
112
-
113
-
114
-
115
-
116
-
117
-
118
-
119
-
120
-
121
-
122
-
123
-
124
-
125
-
126
-
127
-
128
-
129
-
130
-
131
-
132
-
133
-
134
-
135
-
136
-
137
-
138
-
139
-
140
-
141
-
142
-
 143
143 -
 144
144 -
 145
145 -
 146
146 -
 147
147 -
 148
148 -
 149
149 -
 150
150 -
 151
151 -
 152
152 -
 153
153 -
 154
154 -
 155
155 -
 156
156 -
 157
157 -
 158
158 -
 159
159 -
 160
160 -
 161
161 -
 162
162 -
 163
163
 |
 |

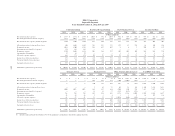
BB&T Corporation
Reportable Segments
Years Ended December 31, 2011, 2010 and 2009
Community Banking Residential Mortgage Banking Dealer Financial Services Specialized Lending
2011 2010 2009 2011 2010 2009 2011 2010 2009 2011 2010 2009
(Dollars in millions)
Net interest income (expense) $ 1,933 $ 1,771 $ 1,654 $ 1,024 $ 981 $ 1,065 $ 852 $ 858 $ 829 $ 635 $ 591 $ 527
Net intersegment interest income (expense) 1,637 2,033 1,916 (737) (721) (722) (277) (344) (376) (184) (184) (224)
Net interest income (expense) and intersegment 3,570 3,804 3,570 287 260 343 575 514 453 451 407 303
Allocated provision for loan and lease losses 608 1,801 1,855 326 553 333 125 93 274 68 110 158
Noninterest income 1,019 1,200 1,226 348 457 607843210176147
Intersegment net referral fees (expense) 134 146 186 — — ———————
Noninterest expense 2,370 2,401 1,918 306 264 257 105 105 107 265 245 225
Amortization of intangibles 47 66 52 — — — 1 1 1566
Allocated corporate expenses 866 771 678 30 23 24 25 22 23 26 35 34
Income (loss) before income taxes 832 111 479 (27) (123) 336 327 297 51 297 187 27
Provision (benefit) for income taxes 299 35 181 (10) (46) 128 123 112 20 59 19 (36)
Segment net income (loss) $ 533 $ 76 $ 298 $ (17) $ (77) $ 208 $ 204 $ 185 $ 31 $ 238 $ 168 $ 63
Identifiable segment assets (period end) $ 60,948 $ 63,244 $ 66,303 $ 25,471 $ 22,183 $ 19,067 $ 9,874 $ 9,418 $ 8,638 $ 16,756 $ 14,945 $ 12,455
Insurance Services Financial Services Other, Treasury and Corporate (1) Total BB&T Corporation
2011 2010 2009 2011 2010 2009 2011 2010 2009 2011 2010 2009
(Dollars in millions)
Net interest income (expense) $ 2 $ 3 $ 5 $ 111 $ 99 $ 54 $ 950 $ 1,017 $ 710 $ 5,507 $ 5,320 $ 4,844
Net intersegment interest income (expense) 6 6 — 259 215 235 (704) (1,005) (829) — — —
Net interest income (expense) and intersegment 8 9 5 370 314 289 246 12 (119) 5,507 5,320 4,844
Allocated provision for loan and lease losses — — — 3 45 33 60 36 158 1,190 2,638 2,811
Noninterest income 1,040 1,033 1,032 692 657 694 (204) 430 225 3,113 3,957 3,934
Intersegment net referral fees (expense) ———191637(153) (162) (223) — — —
Noninterest expense 796 785 765 583 534 543 1,278 1,214 1,002 5,703 5,548 4,817
Amortization of intangibles 42 45 49 3 3 411299122114
Allocated corporate expenses 61 57 51 31 32 32 (1,039) (940) (842) — — —
Income (loss) before income taxes 149 155 172 461 373 408 (411) (31) (437) 1,628 969 1,036
Provision (benefit) for income taxes 45 52 62 170 139 155 (390) (196) (351) 296 115 159
Segment net income (loss) $ 104 $ 103 $ 110 $ 291 $ 234 $ 253 $ (21) $ 165 $ (86) $ 1,332 $ 854 $ 877
Identifiable segment assets (period end) $ 2,352 $ 2,294 $ 2,312 $ 7,546 $ 6,053 $ 5,153 $ 51,632 $ 38,944 $ 51,836 $ 174,579 $ 157,081 $ 165,764
(1) Includes financial data from subsidiaries below the quantitative and qualitative thresholds requiring disclosure.
153