Philips 2013 Annual Report Download - page 112
Download and view the complete annual report
Please find page 112 of the 2013 Philips annual report below. You can navigate through the pages in the report by either clicking on the pages listed below, or by using the keyword search tool below to find specific information within the annual report.-
 1
1 -
2
-
3
-
4
-
5
-
6
-
7
-
8
-
9
-
10
-
11
-
12
-
13
-
14
-
15
-
16
-
17
-
18
-
19
-
20
-
21
-
22
-
23
-
24
-
25
-
26
-
27
-
28
-
29
-
30
-
31
-
32
-
33
-
34
-
35
-
36
-
37
-
38
-
39
-
40
-
41
-
42
-
43
-
44
-
45
-
46
-
47
-
48
-
49
-
50
-
51
-
52
-
53
-
54
-
55
-
56
-
57
-
58
-
59
-
60
-
61
-
62
-
63
-
64
-
65
-
66
-
67
-
68
-
69
-
70
-
71
-
72
-
73
-
74
-
75
-
76
-
77
-
78
-
79
-
80
-
81
-
82
-
83
-
84
-
85
-
86
-
87
-
88
-
89
-
90
-
91
-
92
-
93
-
94
-
95
-
96
-
97
-
98
-
99
-
100
-
101
-
 102
102 -
 103
103 -
 104
104 -
 105
105 -
 106
106 -
 107
107 -
 108
108 -
 109
109 -
 110
110 -
 111
111 -
 112
112 -
 113
113 -
 114
114 -
 115
115 -
 116
116 -
 117
117 -
 118
118 -
 119
119 -
 120
120 -
 121
121 -
 122
122 -
123
-
124
-
125
-
126
-
127
-
128
-
129
-
130
-
131
-
132
-
133
-
134
-
135
-
136
-
137
-
138
-
139
-
140
-
141
-
142
-
143
-
144
-
145
-
146
-
147
-
148
-
149
-
150
-
151
-
152
-
153
-
154
-
155
-
156
-
157
-
158
-
159
-
160
-
161
-
162
-
163
-
164
-
165
-
166
-
167
-
168
-
169
-
170
-
171
-
172
-
173
-
174
-
175
-
176
-
177
-
178
-
179
-
180
-
181
-
182
-
183
-
184
-
185
-
186
-
187
-
188
-
189
-
190
-
191
-
192
-
193
-
194
-
195
-
196
-
197
-
198
-
199
-
200
-
201
-
202
-
203
-
204
-
205
-
206
-
207
-
208
-
209
-
210
-
211
-
212
-
213
-
214
-
215
-
216
-
217
-
218
-
219
-
220
-
221
-
222
-
223
-
224
-
225
-
226
-
227
-
228
-
229
-
230
-
231
-
232
-
233
-
234
-
235
-
236
-
237
-
238
-
239
-
240
-
241
-
242
-
243
-
244
-
245
-
246
-
247
-
248
-
249
-
250
 |
 |

9 Supervisory Board report 9.2.2 - 9.2.6
112 Annual Report 2013
200% of base pay (the CEO 300%). Until this level has
been reached the members of the Board of
Management are required to retain all after-tax shares
derived from any long-term incentive plan.
9.2.3 Scenario analysis
The Remuneration Committee annually conducts
scenario analysis. This includes the calculation of
remuneration under dierent scenarios, whereby
dierent Philips performance assumptions and
corporate actions are looked at. The Supervisory Board
concluded that the current policy has proven to
function well in terms of a relationship between the
strategic objectives and the chosen performance
criteria and believe that new Long-Term Incentive Plan
has further improved this relationship.
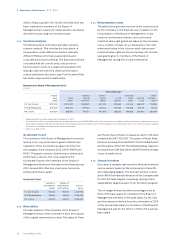
9.2.4 Remuneration costs
The table below gives an overview of the costs incurred
by the Company in the financial year in relation to the
remuneration of the Board of Management. Costs
related to performance shares, stock option and
restricted share right grants are taken by the Company
over a number of years. As a consequence, the costs
mentioned below in the columns stock options and
restricted share rights are the accounting cost of multi-
year grants given to members of the Board of
Management during their board membership.
Remuneration Board of Management 20131)
in euros
Costs in the year2)
annual
base
salary3)
base
salary
realized
annual
incentive
perfor-
mance
shares
stock
options
restricted
share
rights
pension
costs
other
compen-
sation
F.A. van Houten 1,100,000 1,100,000 1,081,520 402,275 218,682 190,441 468,407 75,906
R.H. Wirahadiraksa 675,000 656,250 497,745 205,713 137,926 128,856 263,451 35,732
P.A.J. Nota 625,000 618,750 561,713 190,473 182,835 146,626 253,605 68,206
1) Reference date for board membership is December 31, 2013
2) A crisis tax levy of 16% as imposed by the Dutch government amounts to EUR 681,596 in total . This crisis tax levy is payable by the employer and is charged over income of
employees exceeding a EUR 150,000 threshold in 2013. These expenses do not form part of the remuneration costs mentioned. The costs for the once-only Accelerate!
Grant are not included in the table above. See the table below
3) Salary as of April 1, 2013
Accelerate! Grant
The members of the Board of Management received a
special once-only performance grant related to the
realization of the Accelerate! program and the mid-
term targets of the company (CSG CAGR, EBITA and
ROIC). This grant consists of performance shares and
performance options. The costs related to the
Accelerate! Grant to the members of the Board of
Management have been fully taken in the financial year
2013. Around 450 other key employees received a
similar performance grant.
Accelerate! Grant
number of
performance
shares
number of
performance
stock options
Costs in
euros
F.A. van Houten 55,000 55,000 1,434,933
R.H. Wirahadiraksa 38,500 38,500 1,004,453
P.A.J. Nota 38,500 38,500 1,004,453
9.2.5 Base salary
The base salaries of the members of the Board of
Management have been reviewed in April 2013 as part
of the regular remuneration review. The salary of Frans
van Houten has not been increased per April 1, 2013 and
remained at EUR 1,100,000. The salary of Pieter Nota
has been increased from EUR 600,000 to EUR 625,000
and the salary of the CFO, Ron Wirahadiraksa, has been
increased from EUR 600,000 to EUR 675,000 to bring it
closer to market level.
9.2.6 Annual Incentive
Each year, a variable cash incentive (Annual Incentive)
can be earned, based on the achievement of specific
and challenging targets. The Annual Incentive criteria
are for 80% the financial indicators of the Company and
for 20% the team targets comprising, among others,
sustainability targets as part of our EcoVision program.
The on-target Annual Incentive percentage is set at
60% of the base salary for members of the Board of
Management and 80% of the base salary for the CEO,
and the maximum Annual Incentive achievable is 120%
of the annual base salary for members of the Board of
Management and for the CEO it is 160% of the annual
base salary.