Philips 2013 Annual Report Download - page 164
Download and view the complete annual report
Please find page 164 of the 2013 Philips annual report below. You can navigate through the pages in the report by either clicking on the pages listed below, or by using the keyword search tool below to find specific information within the annual report.-
 1
1 -
2
-
3
-
4
-
5
-
6
-
7
-
8
-
9
-
10
-
11
-
12
-
13
-
14
-
15
-
16
-
17
-
18
-
19
-
20
-
21
-
22
-
23
-
24
-
25
-
26
-
27
-
28
-
29
-
30
-
31
-
32
-
33
-
34
-
35
-
36
-
37
-
38
-
39
-
40
-
41
-
42
-
43
-
44
-
45
-
46
-
47
-
48
-
49
-
50
-
51
-
52
-
53
-
54
-
55
-
56
-
57
-
58
-
59
-
60
-
61
-
62
-
63
-
64
-
65
-
66
-
67
-
68
-
69
-
70
-
71
-
72
-
73
-
74
-
75
-
76
-
77
-
78
-
79
-
80
-
81
-
82
-
83
-
84
-
85
-
86
-
87
-
88
-
89
-
90
-
91
-
92
-
93
-
94
-
95
-
96
-
97
-
98
-
99
-
100
-
101
-
102
-
103
-
104
-
105
-
106
-
107
-
108
-
109
-
110
-
111
-
112
-
113
-
114
-
115
-
116
-
117
-
118
-
119
-
120
-
121
-
122
-
123
-
124
-
125
-
126
-
127
-
128
-
129
-
130
-
131
-
132
-
133
-
134
-
135
-
136
-
137
-
138
-
139
-
140
-
141
-
142
-
143
-
144
-
145
-
146
-
147
-
148
-
149
-
150
-
151
-
152
-
153
-
 154
154 -
 155
155 -
 156
156 -
 157
157 -
 158
158 -
 159
159 -
 160
160 -
 161
161 -
 162
162 -
 163
163 -
 164
164 -
 165
165 -
 166
166 -
 167
167 -
 168
168 -
 169
169 -
 170
170 -
 171
171 -
 172
172 -
 173
173 -
 174
174 -
175
-
176
-
177
-
178
-
179
-
180
-
181
-
182
-
183
-
184
-
185
-
186
-
187
-
188
-
189
-
190
-
191
-
192
-
193
-
194
-
195
-
196
-
197
-
198
-
199
-
200
-
201
-
202
-
203
-
204
-
205
-
206
-
207
-
208
-
209
-
210
-
211
-
212
-
213
-
214
-
215
-
216
-
217
-
218
-
219
-
220
-
221
-
222
-
223
-
224
-
225
-
226
-
227
-
228
-
229
-
230
-
231
-
232
-
233
-
234
-
235
-
236
-
237
-
238
-
239
-
240
-
241
-
242
-
243
-
244
-
245
-
246
-
247
-
248
-
249
-
250
 |
 |

11 Group financial statements 11.9 - 11.9
164 Annual Report 2013
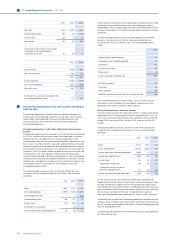
and cash equivalents, (b) deferred tax assets, (c) other (non-)current
financial assets, (d) investments in associates, and after deduction of: (e)
provisions excluding deferred tax liabilities, (f) accounts and notes
payable, (g) accrued liabilities, (h) current/non-current liabilities, and (i)
trading securities.
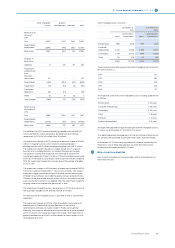
Net debt is defined as the sum of long- and short-term debt minus cash
and cash equivalents. The net debt position as a percentage of the sum of
group equity (shareholders’ equity and non-controlling interests) and net
debt is presented to express the financial strength of the Company. This
measure is widely used by management and investment analysts and is
therefore included in the disclosure. Our net debt position is managed in
such a way that we expect to continuously meet our objective to retain our
target at A3 rating (Moody’s) and A- rating (Standard and Poor’s).
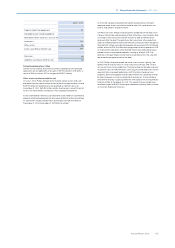
Furthermore, the Group’s objective when managing the net debt position
is to fulfill our commitment to a stable dividend policy with a 40% to 50%
target pay-out from continuing net income.
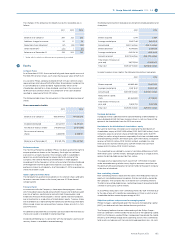
Cash flows before financing activities, being the sum of net cash from
operating activities and net cash from investing activities, are presented
separately to facilitate the reader’s understanding of the Company’s
funding requirements.
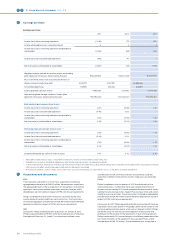
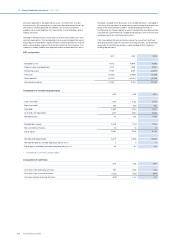
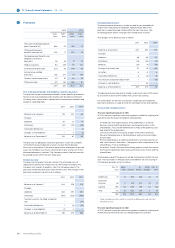
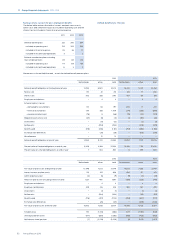
NOC composition
2011 2012 2013
Intangible assets 11,012 10,679 9,766
Property, plant and equipment 3,014 2,959 2,780
Remaining assets 9,393 8,921 8,699
Provisions (2,680) (2,956) (2,554)
Other liabilities (10,357) (10,287) (8,453)
Net operating capital 10,382 9,316 10,238
Composition of net debt to group equity
2011 2012 2013
Long-term debt 3,278 3,725 3,309
Short-term debt 582 809 592
Total debt 3,860 4,534 3,901
Cash and cash equivalents 3,147 3,834 2,465
Net debt (cash)1) 713 700 1,436
Shareholders’ equity 12,328 11,151 11,214
Non-controlling interests 34 34 13
Group equity 12,362 11,185 11,227
Net debt and group equity 13,075 11,885 12,663
Net debt divided by net debt and group equity (in %) 5 6 11
Group equity divided by net debt and group equity (in %) 95 94 89
1) Total debt less cash and cash equivalents
Composition of cash flows
2011 2012 2013
Cash flows from operating activities 760 2,082 1,138
Cash flows from investing activities (1,275) (925) (997)
Cash flows before financing activities (515) 1,157 141