Philips 2013 Annual Report Download - page 66
Download and view the complete annual report
Please find page 66 of the 2013 Philips annual report below. You can navigate through the pages in the report by either clicking on the pages listed below, or by using the keyword search tool below to find specific information within the annual report.-
 1
1 -
2
-
3
-
4
-
5
-
6
-
7
-
8
-
9
-
10
-
11
-
12
-
13
-
14
-
15
-
16
-
17
-
18
-
19
-
20
-
21
-
22
-
23
-
24
-
25
-
26
-
27
-
28
-
29
-
30
-
31
-
32
-
33
-
34
-
35
-
36
-
37
-
38
-
39
-
40
-
41
-
42
-
43
-
44
-
45
-
46
-
47
-
48
-
49
-
50
-
51
-
52
-
53
-
54
-
55
-
 56
56 -
 57
57 -
 58
58 -
 59
59 -
 60
60 -
 61
61 -
 62
62 -
 63
63 -
 64
64 -
 65
65 -
 66
66 -
 67
67 -
 68
68 -
 69
69 -
 70
70 -
 71
71 -
 72
72 -
 73
73 -
 74
74 -
 75
75 -
 76
76 -
77
-
78
-
79
-
80
-
81
-
82
-
83
-
84
-
85
-
86
-
87
-
88
-
89
-
90
-
91
-
92
-
93
-
94
-
95
-
96
-
97
-
98
-
99
-
100
-
101
-
102
-
103
-
104
-
105
-
106
-
107
-
108
-
109
-
110
-
111
-
112
-
113
-
114
-
115
-
116
-
117
-
118
-
119
-
120
-
121
-
122
-
123
-
124
-
125
-
126
-
127
-
128
-
129
-
130
-
131
-
132
-
133
-
134
-
135
-
136
-
137
-
138
-
139
-
140
-
141
-
142
-
143
-
144
-
145
-
146
-
147
-
148
-
149
-
150
-
151
-
152
-
153
-
154
-
155
-
156
-
157
-
158
-
159
-
160
-
161
-
162
-
163
-
164
-
165
-
166
-
167
-
168
-
169
-
170
-
171
-
172
-
173
-
174
-
175
-
176
-
177
-
178
-
179
-
180
-
181
-
182
-
183
-
184
-
185
-
186
-
187
-
188
-
189
-
190
-
191
-
192
-
193
-
194
-
195
-
196
-
197
-
198
-
199
-
200
-
201
-
202
-
203
-
204
-
205
-
206
-
207
-
208
-
209
-
210
-
211
-
212
-
213
-
214
-
215
-
216
-
217
-
218
-
219
-
220
-
221
-
222
-
223
-
224
-
225
-
226
-
227
-
228
-
229
-
230
-
231
-
232
-
233
-
234
-
235
-
236
-
237
-
238
-
239
-
240
-
241
-
242
-
243
-
244
-
245
-
246
-
247
-
248
-
249
-
250
 |
 |

4 Group performance 4.3.3 - 4.3.3
66 Annual Report 2013
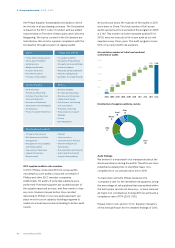
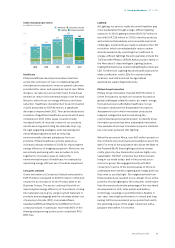
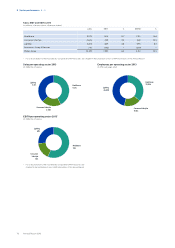
After a decrease in 2012, total emissions from business
travel increased 5% in 2013 as reduced emissions from
our lease car fleet were o-set by increased air travel.
We continue to promote video conferencing as an
alternative to travel. In 2013, logistics CO2 emissions
increased 5% in comparison with 2012. These were
mainly caused by increased air shipments to mitigate
supply shortages in our Lighting sector.
Our operational energy efficiency decreased 5% from
1.15 terajoules per million euro sales in 2012 to 1.21
terajoules per million euro sales in 2013 as a result of
intensified industrial activities, increased business
travel and increased logistics activities.
Operational carbon footprint
in kilotonnes CO2-equivalent
■-logistics_■-business travel
■-non-industrial operations_■-manufacturing
2,500
2,000
1,500
1,000
500
0
2009
627
220
174
909
1,930
2010
672
247
159
767
1,845
2011
657
256
155
703
1,771
2012
546
217
142
709
1,614
2013
575
227
114
738
1,654
Ratios relating to carbon emissions and energy use
2009 2010 2011 2012 2013
Operational CO2
emissions in kilotonnes
CO2-equivalent 1,930 1,845 1,771 1,614 1,654
Operational CO2
efficiency in tonnes CO2-
equivalent per million
euro sales 83 73 70 65 71
Operational energy use
in terajoules 31,145 32,766 31,402 28,405 28,162
Operational energy
efficiency in terajoules
per million euro sales 1.34 1.29 1.24 1.15 1.21
Operational carbon footprint by Greenhouse Gas Protocol
scopes
in kilotonnes CO2-equivalent
2009 2010 2011 2012 2013
Scope 1 447 441 431 443 465
Scope 2 636 485 427 409 387
Scope 3 847 919 913 762 802
Philips Group 1,930 1,845 1,771 1,614 1,654
Water
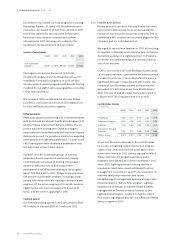
Total water intake in 2013 was 5.0 million m3, about 4%
higher than in 2012. This increase was mainly due to a
new acquisition in China that started to report in 2013,
which accounted for 6% of group water consumption in
2013 as well as increased water use at two Lighting
Lumileds sites, mitigated by water conservation
activities across all sectors.
Lighting represents around 79% of total water usage. In
this sector, water is used in manufacturing as well as for
domestic purpose. The other sectors use water mainly
for domestic purposes.
Water intake
in thousands m3
2009 2010 2011 2012 2013
Healthcare 363 256 308 421 454
Consumer Lifestyle 315 351 338 303 586
Lighting 3,531 3,604 3,682 4,133 4,004
Innovation, Group &
Services 7 7 − − −
Philips Group 4,216 4,218 4,328 4,857 5,044
In 2013, 82% of water was purchased and 18% was
extracted from groundwater wells.
Waste
Total waste increased 5% to 92 kilotonnes in 2013 from
88 kilotonnes in 2012. Lighting (77%) and Consumer
Lifestyle (12%) account for 89% of our total waste. The
increase was mainly due to one-time demolition scrap
at a Lighting site in the Netherlands (10 kilotonnes) and
a new acquisition in China, mitigated by the exclusion
of the AVM&A business in CL and waste reduction
programs in all sectors.
Total waste
in kilotonnes
2009 2010 2011 2012 2013
Healthcare 8.2 11.2 9.3 10.4 9.6
Consumer Lifestyle 20.1 23.2 19.6 12.7 11.4
Lighting 69.3 70.1 65.1 64.5 71.0
Innovation, Group &
Services 0.1 0.1 0.0 0.0 0.0
Philips Group 97.7 104.6 94.0 87.6 92.0
Total waste consists of waste that is delivered for
landfill, incineration or recycling. Materials delivered for
recycling via an external contractor comprised 74
kilotonnes, which equated to 81%, an improvement
compared to 77% in 2012, as our manufacturing sites