Philips 2013 Annual Report Download - page 159
Download and view the complete annual report
Please find page 159 of the 2013 Philips annual report below. You can navigate through the pages in the report by either clicking on the pages listed below, or by using the keyword search tool below to find specific information within the annual report.-
 1
1 -
2
-
3
-
4
-
5
-
6
-
7
-
8
-
9
-
10
-
11
-
12
-
13
-
14
-
15
-
16
-
17
-
18
-
19
-
20
-
21
-
22
-
23
-
24
-
25
-
26
-
27
-
28
-
29
-
30
-
31
-
32
-
33
-
34
-
35
-
36
-
37
-
38
-
39
-
40
-
41
-
42
-
43
-
44
-
45
-
46
-
47
-
48
-
49
-
50
-
51
-
52
-
53
-
54
-
55
-
56
-
57
-
58
-
59
-
60
-
61
-
62
-
63
-
64
-
65
-
66
-
67
-
68
-
69
-
70
-
71
-
72
-
73
-
74
-
75
-
76
-
77
-
78
-
79
-
80
-
81
-
82
-
83
-
84
-
85
-
86
-
87
-
88
-
89
-
90
-
91
-
92
-
93
-
94
-
95
-
96
-
97
-
98
-
99
-
100
-
101
-
102
-
103
-
104
-
105
-
106
-
107
-
108
-
109
-
110
-
111
-
112
-
113
-
114
-
115
-
116
-
117
-
118
-
119
-
120
-
121
-
122
-
123
-
124
-
125
-
126
-
127
-
128
-
129
-
130
-
131
-
132
-
133
-
134
-
135
-
136
-
137
-
138
-
139
-
140
-
141
-
142
-
143
-
144
-
145
-
146
-
147
-
148
-
 149
149 -
 150
150 -
 151
151 -
 152
152 -
 153
153 -
 154
154 -
 155
155 -
 156
156 -
 157
157 -
 158
158 -
 159
159 -
 160
160 -
 161
161 -
 162
162 -
 163
163 -
 164
164 -
 165
165 -
 166
166 -
 167
167 -
 168
168 -
 169
169 -
170
-
171
-
172
-
173
-
174
-
175
-
176
-
177
-
178
-
179
-
180
-
181
-
182
-
183
-
184
-
185
-
186
-
187
-
188
-
189
-
190
-
191
-
192
-
193
-
194
-
195
-
196
-
197
-
198
-
199
-
200
-
201
-
202
-
203
-
204
-
205
-
206
-
207
-
208
-
209
-
210
-
211
-
212
-
213
-
214
-
215
-
216
-
217
-
218
-
219
-
220
-
221
-
222
-
223
-
224
-
225
-
226
-
227
-
228
-
229
-
230
-
231
-
232
-
233
-
234
-
235
-
236
-
237
-
238
-
239
-
240
-
241
-
242
-
243
-
244
-
245
-
246
-
247
-
248
-
249
-
250
 |
 |

11 Group financial statements 11.9 - 11.9 11
Annual Report 2013 159
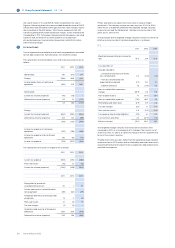
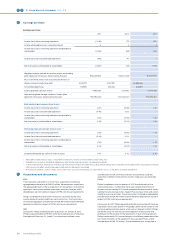
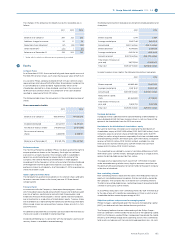
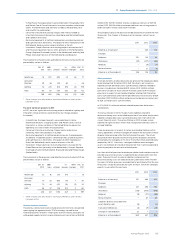
11 Goodwill
The changes in 2012 and 2013 were as follows:
2012 2013
Balance as of January 1:
Cost 9,224 9,119
Amortization and impairments (2,208) (2,171)
Book value 7,016 6,948
Changes in book value:
Acquisitions 100 4
Purchase price allocation adjustment (2) (4)
Impairments − (26)
Divestments and transfers to assets classified as
held for sale (6) (55)
Translation dierences (160) (363)
Balance as of December 31:
Cost 9,119 8,596
Amortization and impairments (2,171) (2,092)
Book value 6,948 6,504
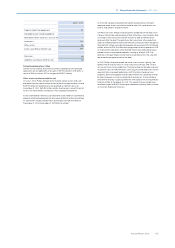
The movement of EUR 55 million in Divestments and transfers to assets
classified as held for sale mainly relate to divestments in the Healthcare
sector.
Acquisitions in 2012 include goodwill related to the acquisition of Indal for
EUR 100 million. In addition, goodwill changed due to the finalization of
purchase price accounting related to acquisitions in the prior year.
For impairment testing, goodwill is allocated to (groups of) cash-
generating units (typically one level below operating sector level), which
represents the lowest level at which the goodwill is monitored internally
for management purposes.
Goodwill allocated to the cash-generating units Respiratory Care & Sleep
Management, Imaging Systems, Patient Care & Clinical Informatics and
Professional Lighting Solutions is considered to be significant in
comparison to the total book value of goodwill for the Group at December
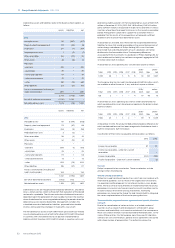
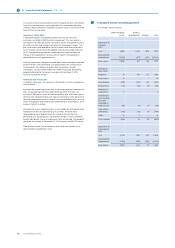
31, 2013. The amounts allocated are presented below:
2012 2013
Respiratory Care & Sleep Management 1,706 1,544
Imaging Systems 1,482 1,414
Patient Care & Clinical Informatics 1,331 1,271
Professional Lighting Solutions 1,337 1,266
The basis of the recoverable amount used in the annual (performed in the
second quarter) and trigger-based impairment tests for the units disclosed
in this note is the value in use. Key assumptions used in the impairment
tests for the units were sales growth rates, income from operations and the
rates used for discounting the projected cash flows. These cash flow
projections were determined using management’s internal forecasts that
cover an initial period from 2013 to 2017 that matches the period used for
our strategic process. Projections were extrapolated with stable or
declining growth rates for a period of 5 years, after which a terminal value
was calculated. For terminal value calculation, growth rates were capped
at a historical long-term average growth rate.
The sales growth rates and margins used to estimate cash flows are based
on past performance, external market growth assumptions and industry
long-term growth averages.
Income from operations in all units is expected to increase over the
projection period as a result of volume growth and cost efficiencies.
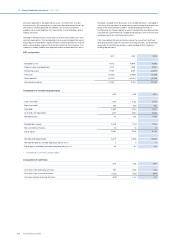
Cash flow projections of Respiratory Care & Sleep Management, Imaging
Systems, Patient Care & Clinical Informatics and Professional Lighting
Solutions for 2013 were based on the following key assumptions (based
on the annual impairment test performed in the second quarter):
in %
compound sales growth rate1)
initial
forecast
period
extra-
polation
period2)
used to
calculate
terminal
value
pre-tax
discount
rates
Respiratory Care & Sleep
Management 4.9 3.7 2.7 11.3
Imaging Systems 3.9 3.4 2.7 12.4
Patient Care & Clinical
Informatics 4.1 3.5 2.7 13.2
Professional Lighting
Solutions 7.4 5.4 2.7 12.8
1) Compound sales growth rate is the annualized steady growth rate over the
forecast period
2) Also referred to later in the text as compound long-term sales growth rate
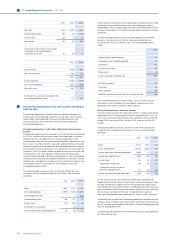
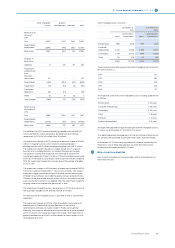
The assumptions used for the 2012 cash flow projections were as follows:
in %
compound sales growth rate1)
initial
forecast
period
extra-
polation
period2)
used to
calculate
terminal
value
pre-tax
discount
rates
Respiratory Care & Sleep
Management 8.0 5.8 2.7 11.2
Imaging Systems 3.4 2.9 2.7 12.8
Patient Care & Clinical
Informatics 6.5 4.1 2.7 13.2
Professional Lighting
Solutions 6.6 5.3 2.7 13.0
1) Compound sales growth rate is the annualized steady growth rate over the
forecast period
2) Also referred to later in the text as compound long-term sales growth rate
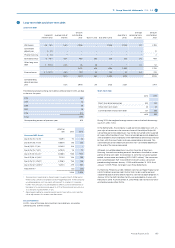
Among the mentioned units, Respiratory Care & Sleep Management and
Professional Lighting Solutions have the highest amount of goodwill and
the lowest excess of the recoverable amount over the carrying amount.
The headroom of Respiratory Care & Sleep Management was estimated at
EUR 660 million, the headroom of Professional Lighting Solutions at EUR
670 million. The increase in the headroom of Professional Lighting
Solutions compared to the annual impairment test 2012, in which the
headroom approximated the carrying value, is mainly explained by
increased forecasted profitability assumptions driven by gross margin
improvements. The following changes could, individually, cause the value
in use to fall to the level of the carrying value:
increase in
pre-tax
discount
rate, basis
points
decrease in
long-term
growth rate,
basis points
decrease in
terminal
value
amount, %
Respiratory Care & Sleep
Management 290 550 39
Professional Lighting
Solutions 290 520 39