Philips 2013 Annual Report Download - page 173
Download and view the complete annual report
Please find page 173 of the 2013 Philips annual report below. You can navigate through the pages in the report by either clicking on the pages listed below, or by using the keyword search tool below to find specific information within the annual report.-
 1
1 -
2
-
3
-
4
-
5
-
6
-
7
-
8
-
9
-
10
-
11
-
12
-
13
-
14
-
15
-
16
-
17
-
18
-
19
-
20
-
21
-
22
-
23
-
24
-
25
-
26
-
27
-
28
-
29
-
30
-
31
-
32
-
33
-
34
-
35
-
36
-
37
-
38
-
39
-
40
-
41
-
42
-
43
-
44
-
45
-
46
-
47
-
48
-
49
-
50
-
51
-
52
-
53
-
54
-
55
-
56
-
57
-
58
-
59
-
60
-
61
-
62
-
63
-
64
-
65
-
66
-
67
-
68
-
69
-
70
-
71
-
72
-
73
-
74
-
75
-
76
-
77
-
78
-
79
-
80
-
81
-
82
-
83
-
84
-
85
-
86
-
87
-
88
-
89
-
90
-
91
-
92
-
93
-
94
-
95
-
96
-
97
-
98
-
99
-
100
-
101
-
102
-
103
-
104
-
105
-
106
-
107
-
108
-
109
-
110
-
111
-
112
-
113
-
114
-
115
-
116
-
117
-
118
-
119
-
120
-
121
-
122
-
123
-
124
-
125
-
126
-
127
-
128
-
129
-
130
-
131
-
132
-
133
-
134
-
135
-
136
-
137
-
138
-
139
-
140
-
141
-
142
-
143
-
144
-
145
-
146
-
147
-
148
-
149
-
150
-
151
-
152
-
153
-
154
-
155
-
156
-
157
-
158
-
159
-
160
-
161
-
162
-
 163
163 -
 164
164 -
 165
165 -
 166
166 -
 167
167 -
 168
168 -
 169
169 -
 170
170 -
 171
171 -
 172
172 -
 173
173 -
 174
174 -
 175
175 -
 176
176 -
 177
177 -
 178
178 -
 179
179 -
 180
180 -
 181
181 -
 182
182 -
 183
183 -
184
-
185
-
186
-
187
-
188
-
189
-
190
-
191
-
192
-
193
-
194
-
195
-
196
-
197
-
198
-
199
-
200
-
201
-
202
-
203
-
204
-
205
-
206
-
207
-
208
-
209
-
210
-
211
-
212
-
213
-
214
-
215
-
216
-
217
-
218
-
219
-
220
-
221
-
222
-
223
-
224
-
225
-
226
-
227
-
228
-
229
-
230
-
231
-
232
-
233
-
234
-
235
-
236
-
237
-
238
-
239
-
240
-
241
-
242
-
243
-
244
-
245
-
246
-
247
-
248
-
249
-
250
 |
 |

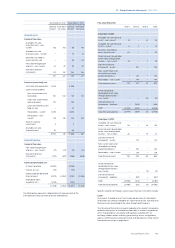
11 Group financial statements 11.9 - 11.9
Annual Report 2013 173
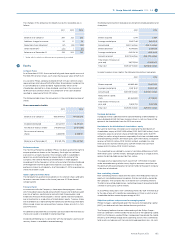
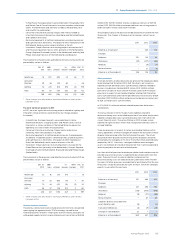
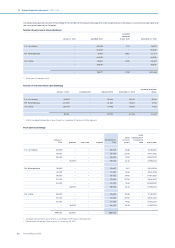
The classification of the net balance is as follows:
2012 2013
Netherlands other total Netherlands other total
Prepaid pension costs under other non-current assets − 7 7 − 5 5
Accrued pension costs under other liabilities − (1,173) (1,173) − (817) (817)
Provision for pensions under provisions (7) (853) (860) (6) (799) (805)
(7) (2,019) (2,026) (6) (1,611) (1,617)
Changes in the eect of the asset ceiling
2012 2013
Netherlands other total Netherlands other total
Unrecognized assets at the beginning of year 660 399 1,059 777 586 1,363
Interest on unrecognized assets 26 25 51 25 31 56
Remeasurements 91 173 264 (247) (155) (402)
Exchange rate dierences − (11) (11) − (34) (34)
Unrecognized assets at the end of year 777 586 1,363 555 428 983
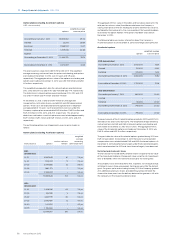
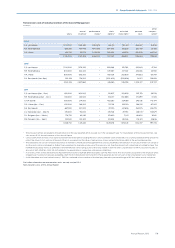
Plan assets allocation
The asset allocation in the Company’s pension plans at December 31 was
as follows:
2012 2013
Netherlands other Netherlands other
Matching portfolio:
- Debt securities 11,734 6,106 11,238 4,282
Return portfolio:
- Equity securities 2,366 1,083 2,524 910
- Real estate 683 19 790 9
- Other 420 380 291 1,527
15,203 7,588 14,843 6,728
The assets in 2013 contain 14% (2012: 11%) unquoted assets, the increase
compared to 2012 mainly related to the buy-in value in the UK plan. Plan
assets in 2013 do not include property occupied by or financial
instruments issued by the Company
Assumptions
The mortality tables used for the Company’s major schemes are:
• Netherlands: Prognosis table 2012-2062 including experience rating
TW2012.
• United Kingdom retirees: SAPS 2002- Core CMI 2011 projection
• United States: RP2000 CH Fully Generational
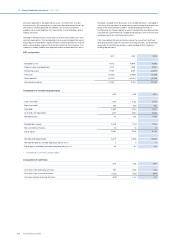
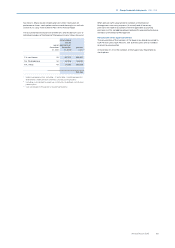
The weighted averages of the assumptions used to calculate the defined-
benefit obligations as of December 31 were as follows:
2012 2013
Netherlands other Netherlands other
Discount rate 3.3% 4.1% 3.4% 4.5%
Rate of
compensation
increase * 3.3% * 3.2%
* The rate of compensation increase for the Netherlands consists of a
general compensation increase and an individual salary increase based
on merit, seniority and promotion. In 2013 the Company determined new
turnover- and disability rates and individual salary rates for all active
participants based on the period 2010-2012. The individual increase at the
average age of 45 is 1.75% (2012 0.75% for CLA A). The indexation
assumption used to calculate the defined benefit obligations for the
Netherlands is 1.0% (2012: 1.0%).
The (average) duration of the DBO of the pension plans is 15 years for the
Netherlands (2012: 14 years) and 11 years for other countries (2012: 11
years).
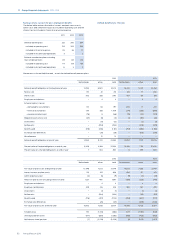
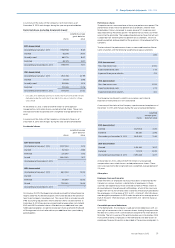
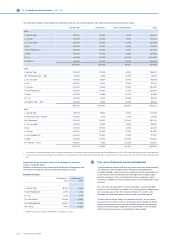
Defined-benefit plans: retiree medical plans
Movements in the net liability for retiree medical plans:
2012 2013
Defined-benefit obligation at the beginning of year 269 250
Service cost 1 1
Interest cost 12 10
Actuarial (gains) or losses arising from:
– financial assumptions 1 (17)
Past service cost (25) −
Benefits paid (17) (15)
Exchange rate dierences (6) (16)
Miscellaneous 15 −
Defined-benefit obligation at end of year 250 213
Present value of funded obligations at end of year − −
Present value of unfunded obligations at end of
year 250 213
Funded status (250) (213)
Net balances (250) (213)
Classification of the net balance is as follows:
Provision for other postretirement benefits (250) (213)