Philips 2013 Annual Report Download - page 235
Download and view the complete annual report
Please find page 235 of the 2013 Philips annual report below. You can navigate through the pages in the report by either clicking on the pages listed below, or by using the keyword search tool below to find specific information within the annual report.-
 1
1 -
2
-
3
-
4
-
5
-
6
-
7
-
8
-
9
-
10
-
11
-
12
-
13
-
14
-
15
-
16
-
17
-
18
-
19
-
20
-
21
-
22
-
23
-
24
-
25
-
26
-
27
-
28
-
29
-
30
-
31
-
32
-
33
-
34
-
35
-
36
-
37
-
38
-
39
-
40
-
41
-
42
-
43
-
44
-
45
-
46
-
47
-
48
-
49
-
50
-
51
-
52
-
53
-
54
-
55
-
56
-
57
-
58
-
59
-
60
-
61
-
62
-
63
-
64
-
65
-
66
-
67
-
68
-
69
-
70
-
71
-
72
-
73
-
74
-
75
-
76
-
77
-
78
-
79
-
80
-
81
-
82
-
83
-
84
-
85
-
86
-
87
-
88
-
89
-
90
-
91
-
92
-
93
-
94
-
95
-
96
-
97
-
98
-
99
-
100
-
101
-
102
-
103
-
104
-
105
-
106
-
107
-
108
-
109
-
110
-
111
-
112
-
113
-
114
-
115
-
116
-
117
-
118
-
119
-
120
-
121
-
122
-
123
-
124
-
125
-
126
-
127
-
128
-
129
-
130
-
131
-
132
-
133
-
134
-
135
-
136
-
137
-
138
-
139
-
140
-
141
-
142
-
143
-
144
-
145
-
146
-
147
-
148
-
149
-
150
-
151
-
152
-
153
-
154
-
155
-
156
-
157
-
158
-
159
-
160
-
161
-
162
-
163
-
164
-
165
-
166
-
167
-
168
-
169
-
170
-
171
-
172
-
173
-
174
-
175
-
176
-
177
-
178
-
179
-
180
-
181
-
182
-
183
-
184
-
185
-
186
-
187
-
188
-
189
-
190
-
191
-
192
-
193
-
194
-
195
-
196
-
197
-
198
-
199
-
200
-
201
-
202
-
203
-
204
-
205
-
206
-
207
-
208
-
209
-
210
-
211
-
212
-
213
-
214
-
215
-
216
-
217
-
218
-
219
-
220
-
221
-
222
-
223
-
224
-
 225
225 -
 226
226 -
 227
227 -
 228
228 -
 229
229 -
 230
230 -
 231
231 -
 232
232 -
 233
233 -
 234
234 -
 235
235 -
 236
236 -
 237
237 -
 238
238 -
 239
239 -
 240
240 -
 241
241 -
 242
242 -
 243
243 -
 244
244 -
 245
245 -
246
-
247
-
248
-
249
-
250
 |
 |

16 Investor Relations 16.1 - 16.2
Annual Report 2013 235
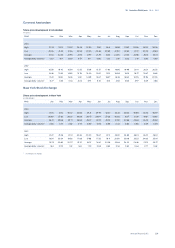
EUR per USD
period end average high low
2008 0.7184 0.6844 0.8035 0.6246
2009 0.6977 0.7187 0.7970 0.6623
2010 0.7536 0.7579 0.8362 0.6879
2011 0.7708 0.7186 0.7736 0.6723
2012 0.7584 0.7782 0.8290 0.7428
2013 0.7257 0.7532 0.7828 0.7238
highest rate lowest rate
August, 2013 0.7578 0.7448
September, 2013 0.7622 0.7387
October, 2013 0.7413 0.7241
November, 2013 0.7487 0.7350
December, 2013 0.7379 0.7238
January, 2014 0.7407 0.7309
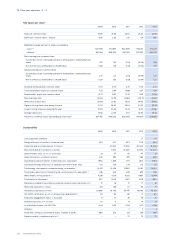
Philips publishes its financial statements in euros while
a substantial portion of its net assets, earnings and
sales are denominated in other currencies. Philips
conducts its business in more than 50 dierent
currencies.
Unless otherwise stated, for the convenience of the
reader the translations of euros into US dollars
appearing in this report have been made based on the
closing rate on December 31, 2013 (USD 1 = EUR 0.7255).
This rate is not materially dierent from the Noon
Buying Rate on such date (USD 1 = EUR 0.7257).
The following table sets out the exchange rate for US
dollars into euros applicable for translation of Philips’
financial statements for the periods specified.
EUR per USD
period end average high low
2008 0.7096 0.6832 0.7740 0.6355
2009 0.6945 0.7170 0.7853 0.6634
2010 0.7485 0.7540 0.8188 0.7036
2011 0.7728 0.7192 0.7728 0.6721
2012 0.7582 0.7776 0.8166 0.7500
2013 0.7255 0.7527 0.7805 0.7255
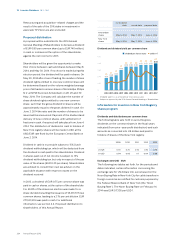
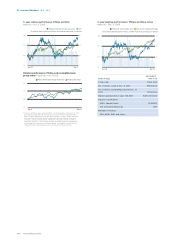
16.2 Share information
Market capitalization
Philips’ market capitalization was EUR 24.3 billion at
year-end 2013. The highest closing price for Philips’
shares during 2013 in Amsterdam was EUR 26.78 on
December 27, 2013 and the lowest was EUR 20.26 on
January 4, 2013. The highest closing price for Philips’
shares during 2013 in New York was USD 36.97 on
December 31, 2013 and the lowest was USD 26.60 on
January 4, 2013.
Market capitalization
in billions of euros ■-market capitalization of Philips
25
20
15
10
5
0
2009 2010 2011 2012 2013
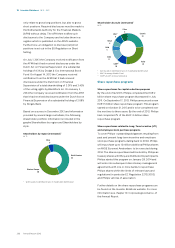
Share capital structure
During 2013, Philips’ issued share capital decreased by
approximately 19 million common shares to a level of
938 million common shares. The main reasons for this
are the cancellation of 37,778,510 Philips shares
acquired pursuant to the EUR 2 billion share repurchase
program and the issuance of 18,491,337 shares related
to the elective dividend. The basic shares outstanding
decreased from 915 million at the end of December
2012 to 913 million at the end of 2013. As of December
31, 2013, the shares held in treasury amounted to 25
million shares, of which 21 million are held by Philips to
cover long-term incentive and employee stock
purchase plans.
The Dutch Act on Financial Supervision imposes an
obligation to disclose (inter alia) percentage holdings in
the capital and/or voting rights in the Company when
such holdings reach, exceed or fall below 3, 5, 10, 15, 20,
25, 30, 40, 50, 60, 75 and 95 percent (as a result of an
acquisition or disposal by a person, or as a result of a
change in the company’s total number of voting rights
or capital issued). Certain cash settled derivatives are
also taken into account when calculating the capital
interest. Pursuant to new legislation, eective July 1,
2013, the obligation to disclose capital interest does not