Philips 2013 Annual Report Download - page 238
Download and view the complete annual report
Please find page 238 of the 2013 Philips annual report below. You can navigate through the pages in the report by either clicking on the pages listed below, or by using the keyword search tool below to find specific information within the annual report.-
 1
1 -
2
-
3
-
4
-
5
-
6
-
7
-
8
-
9
-
10
-
11
-
12
-
13
-
14
-
15
-
16
-
17
-
18
-
19
-
20
-
21
-
22
-
23
-
24
-
25
-
26
-
27
-
28
-
29
-
30
-
31
-
32
-
33
-
34
-
35
-
36
-
37
-
38
-
39
-
40
-
41
-
42
-
43
-
44
-
45
-
46
-
47
-
48
-
49
-
50
-
51
-
52
-
53
-
54
-
55
-
56
-
57
-
58
-
59
-
60
-
61
-
62
-
63
-
64
-
65
-
66
-
67
-
68
-
69
-
70
-
71
-
72
-
73
-
74
-
75
-
76
-
77
-
78
-
79
-
80
-
81
-
82
-
83
-
84
-
85
-
86
-
87
-
88
-
89
-
90
-
91
-
92
-
93
-
94
-
95
-
96
-
97
-
98
-
99
-
100
-
101
-
102
-
103
-
104
-
105
-
106
-
107
-
108
-
109
-
110
-
111
-
112
-
113
-
114
-
115
-
116
-
117
-
118
-
119
-
120
-
121
-
122
-
123
-
124
-
125
-
126
-
127
-
128
-
129
-
130
-
131
-
132
-
133
-
134
-
135
-
136
-
137
-
138
-
139
-
140
-
141
-
142
-
143
-
144
-
145
-
146
-
147
-
148
-
149
-
150
-
151
-
152
-
153
-
154
-
155
-
156
-
157
-
158
-
159
-
160
-
161
-
162
-
163
-
164
-
165
-
166
-
167
-
168
-
169
-
170
-
171
-
172
-
173
-
174
-
175
-
176
-
177
-
178
-
179
-
180
-
181
-
182
-
183
-
184
-
185
-
186
-
187
-
188
-
189
-
190
-
191
-
192
-
193
-
194
-
195
-
196
-
197
-
198
-
199
-
200
-
201
-
202
-
203
-
204
-
205
-
206
-
207
-
208
-
209
-
210
-
211
-
212
-
213
-
214
-
215
-
216
-
217
-
218
-
219
-
220
-
221
-
222
-
223
-
224
-
225
-
226
-
227
-
 228
228 -
 229
229 -
 230
230 -
 231
231 -
 232
232 -
 233
233 -
 234
234 -
 235
235 -
 236
236 -
 237
237 -
 238
238 -
 239
239 -
 240
240 -
 241
241 -
 242
242 -
 243
243 -
 244
244 -
 245
245 -
 246
246 -
 247
247 -
 248
248 -
249
-
250
 |
 |
16 Investor Relations 16.4 - 16.4
238 Annual Report 2013
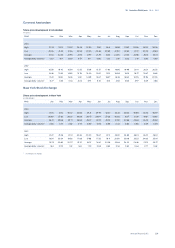
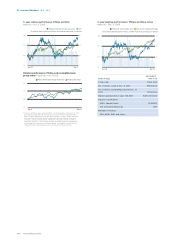
16.4 Performance in relation to market indices
The common shares of the Company are listed on the
stock market of NYSE Euronext Amsterdam. The New
York Registry Shares of the Company, representing
common shares of the Company, are listed on the New
York Stock Exchange. The principal market for the
common shares is NYSE Euronext Amsterdam. For the
New York Registry Shares it is the New York Stock
Exchange.
The following table shows the high and low closing sales prices of the common shares on the stock market of NYSE Euronext
Amsterdam as reported in the Official Price List and the high and low closing sales prices of the New York Registry Shares on
the New York Stock Exchange:
Euronext Amsterdam (EUR) New York stock exchange (USD)
high low high low
2009 21.03 10.95 30.19 13.98
2010 1st quarter 25.28 20.34 33.48 28.26
2nd quarter 26.94 22.83 35.90 28.09
3rd quarter 26.23 21.32 33.32 26.84
4th quarter 24.19 20.79 33.90 27.10
2011 1st quarter 25.34 21.73 33.81 29.81
2nd quarter 22.84 16.33 32.44 23.36
3rd quarter 17.84 12.23 25.74 16.87
4th quarter 16.28 12.77 22.54 17.22
2012 1st quarter 16.56 14.48 21.51 18.34
2nd quarter 15.57 13.76 20.26 17.32
3rd quarter 19.49 15.51 24.89 19.11
4th quarter 20.33 18.27 26.81 23.52
2013 1st quarter 23.67 20.26 31.72 26.60
2nd quarter 23.48 20.36 30.65 26.75
3rd quarter 25.32 20.89 33.60 27.28
4th quarter 26.78 23.17 36.97 31.36
August, 2013 24.58 22.90 32.45 30.62
September, 2013 25.32 23.83 33.60 31.57
October, 2013 26.08 23.17 35.69 31.36
November, 2013 26.50 25.70 35.76 34.81
December, 2013 26.78 24.64 36.97 33.92
January, 2014 28.10 25.52 38.36 34.61