Philips 2013 Annual Report Download - page 52
Download and view the complete annual report
Please find page 52 of the 2013 Philips annual report below. You can navigate through the pages in the report by either clicking on the pages listed below, or by using the keyword search tool below to find specific information within the annual report.-
 1
1 -
2
-
3
-
4
-
5
-
6
-
7
-
8
-
9
-
10
-
11
-
12
-
13
-
14
-
15
-
16
-
17
-
18
-
19
-
20
-
21
-
22
-
23
-
24
-
25
-
26
-
27
-
28
-
29
-
30
-
31
-
32
-
33
-
34
-
35
-
36
-
37
-
38
-
39
-
40
-
41
-
 42
42 -
 43
43 -
 44
44 -
 45
45 -
 46
46 -
 47
47 -
 48
48 -
 49
49 -
 50
50 -
 51
51 -
 52
52 -
 53
53 -
 54
54 -
 55
55 -
 56
56 -
 57
57 -
 58
58 -
 59
59 -
 60
60 -
 61
61 -
 62
62 -
63
-
64
-
65
-
66
-
67
-
68
-
69
-
70
-
71
-
72
-
73
-
74
-
75
-
76
-
77
-
78
-
79
-
80
-
81
-
82
-
83
-
84
-
85
-
86
-
87
-
88
-
89
-
90
-
91
-
92
-
93
-
94
-
95
-
96
-
97
-
98
-
99
-
100
-
101
-
102
-
103
-
104
-
105
-
106
-
107
-
108
-
109
-
110
-
111
-
112
-
113
-
114
-
115
-
116
-
117
-
118
-
119
-
120
-
121
-
122
-
123
-
124
-
125
-
126
-
127
-
128
-
129
-
130
-
131
-
132
-
133
-
134
-
135
-
136
-
137
-
138
-
139
-
140
-
141
-
142
-
143
-
144
-
145
-
146
-
147
-
148
-
149
-
150
-
151
-
152
-
153
-
154
-
155
-
156
-
157
-
158
-
159
-
160
-
161
-
162
-
163
-
164
-
165
-
166
-
167
-
168
-
169
-
170
-
171
-
172
-
173
-
174
-
175
-
176
-
177
-
178
-
179
-
180
-
181
-
182
-
183
-
184
-
185
-
186
-
187
-
188
-
189
-
190
-
191
-
192
-
193
-
194
-
195
-
196
-
197
-
198
-
199
-
200
-
201
-
202
-
203
-
204
-
205
-
206
-
207
-
208
-
209
-
210
-
211
-
212
-
213
-
214
-
215
-
216
-
217
-
218
-
219
-
220
-
221
-
222
-
223
-
224
-
225
-
226
-
227
-
228
-
229
-
230
-
231
-
232
-
233
-
234
-
235
-
236
-
237
-
238
-
239
-
240
-
241
-
242
-
243
-
244
-
245
-
246
-
247
-
248
-
249
-
250
 |
 |

4 Group performance 4.2 - 4.2.2
52 Annual Report 2013
4.2 Social performance
Our businesses provide innovative solutions that
address major trends aecting the world – the demand
for aordable healthcare, the need for greater energy
efficiency and the desire for personal well-being.
In 2013, Philips further strengthened its focus on
sustainability. This is rooted in our long-standing belief
that sustainability is a key enabler of value creation and
oers opportunities to innovate our way out of the
challenging economic circumstances. Therefore,
sustainability is an integral part of Philips’ vision and
strategy.
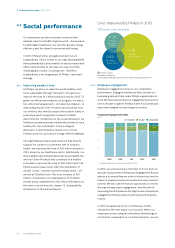
4.2.1 Improving people’s lives
At Philips, we strive to make the world healthier and
more sustainable through innovation. Our goal is to
improve the lives of 3 billion people a year by 2025. To
guide our eorts and measure our progress, we take a
two-dimensional approach – social and ecological – to
improving people’s lives. Products and solutions from
our portfolio that directly support the curative (care) or
preventive (well-being) side of people’s health,
determine the contribution to the social dimension. As
healthy ecosystems are also needed for people to live a
healthy life, the contribution to the ecological
dimension is determined by means of our Green
Product portfolio, such as our energy-efficient lighting.
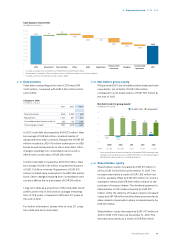
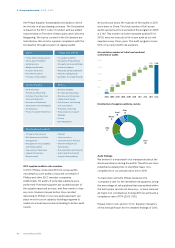
Through Philips products and solutions that directly
support the curative or preventive side of people’s
health, we improved the lives of 630 million people in
2013, driven by our Healthcare sector. Additionally, our
well-being products that help people live a healthy life,
and our Green Products that contribute to a healthy
ecosystem, improved the lives of 290 million and 1.49
billion people respectively. After the elimination of
double counts - people touched multiple times - we
arrived at 1.8 billion lives. This is an increase of 100
million compared to our total baseline of 1.7 billion
people a year, established in 2012. More information on
this metric can be found in chapter 13, Sustainability
statements, of this Annual Report.
Double counts
Numbers in billions
Conceptual drawing, areas do not reflect actual proportions
Lives improved by Philips in 2013
1.49
0.63
1.8 (double counts eliminated)
By Philips
green products
0.29
By Philips
well-being
products
By Philips
care products
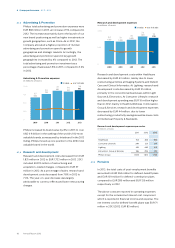
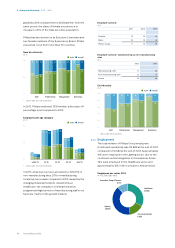
4.2.2 Employee engagement
Employee engagement is key to our competitive
performance. Engaged employees help us meet our
business goals and help make Philips a great place to
work. We have used employee engagement surveys for
over a decade to gather feedback and focus areas and
have seen tangible results along our journey.
Employee Engagement Index
in % ■-favorable--■-neutral--■-unfavorable
100
75
50
25
0
2009
71
15
14
2010
77
12
11
2011
76
14
10
20121)
79
15 6
2013
75
16
9
1) Based on 60 pulse surveys conducted in 2012
In 2012, we announced our intention to move from an
annual measurement of Employee Engagement Survey
data to a bi-annual basis in order to allow more time for
teams to analyze results and implement improvement
actions. We also used this as an opportunity to review
the way we approach engagement, with the aim of
improving the link between the high levels of employee
engagement that we achieve and improved business
results.
In 2013 we applied a more contemporary model
relevant for the next steps in our journey. While our
employee survey using the refreshed methodology is
not directly comparable to our historical metric, we see