Philips 2013 Annual Report Download - page 54
Download and view the complete annual report
Please find page 54 of the 2013 Philips annual report below. You can navigate through the pages in the report by either clicking on the pages listed below, or by using the keyword search tool below to find specific information within the annual report.-
 1
1 -
2
-
3
-
4
-
5
-
6
-
7
-
8
-
9
-
10
-
11
-
12
-
13
-
14
-
15
-
16
-
17
-
18
-
19
-
20
-
21
-
22
-
23
-
24
-
25
-
26
-
27
-
28
-
29
-
30
-
31
-
32
-
33
-
34
-
35
-
36
-
37
-
38
-
39
-
40
-
41
-
42
-
43
-
 44
44 -
 45
45 -
 46
46 -
 47
47 -
 48
48 -
 49
49 -
 50
50 -
 51
51 -
 52
52 -
 53
53 -
 54
54 -
 55
55 -
 56
56 -
 57
57 -
 58
58 -
 59
59 -
 60
60 -
 61
61 -
 62
62 -
 63
63 -
 64
64 -
65
-
66
-
67
-
68
-
69
-
70
-
71
-
72
-
73
-
74
-
75
-
76
-
77
-
78
-
79
-
80
-
81
-
82
-
83
-
84
-
85
-
86
-
87
-
88
-
89
-
90
-
91
-
92
-
93
-
94
-
95
-
96
-
97
-
98
-
99
-
100
-
101
-
102
-
103
-
104
-
105
-
106
-
107
-
108
-
109
-
110
-
111
-
112
-
113
-
114
-
115
-
116
-
117
-
118
-
119
-
120
-
121
-
122
-
123
-
124
-
125
-
126
-
127
-
128
-
129
-
130
-
131
-
132
-
133
-
134
-
135
-
136
-
137
-
138
-
139
-
140
-
141
-
142
-
143
-
144
-
145
-
146
-
147
-
148
-
149
-
150
-
151
-
152
-
153
-
154
-
155
-
156
-
157
-
158
-
159
-
160
-
161
-
162
-
163
-
164
-
165
-
166
-
167
-
168
-
169
-
170
-
171
-
172
-
173
-
174
-
175
-
176
-
177
-
178
-
179
-
180
-
181
-
182
-
183
-
184
-
185
-
186
-
187
-
188
-
189
-
190
-
191
-
192
-
193
-
194
-
195
-
196
-
197
-
198
-
199
-
200
-
201
-
202
-
203
-
204
-
205
-
206
-
207
-
208
-
209
-
210
-
211
-
212
-
213
-
214
-
215
-
216
-
217
-
218
-
219
-
220
-
221
-
222
-
223
-
224
-
225
-
226
-
227
-
228
-
229
-
230
-
231
-
232
-
233
-
234
-
235
-
236
-
237
-
238
-
239
-
240
-
241
-
242
-
243
-
244
-
245
-
246
-
247
-
248
-
249
-
250
 |
 |

4 Group performance 4.2.3 - 4.2.4
54 Annual Report 2013
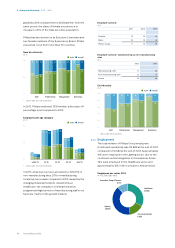
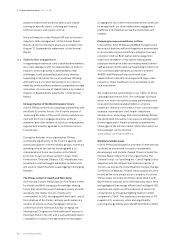
grade) by 2016 compared to the 2012 baseline. Over the
same period, the share of female executives is to
increase to 20% of the total executive population.
Philips has two women on its Executive Committee and
two female members of the Supervisory Board. Philips
executives come from more than 30 countries.
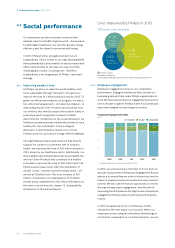
New hire diversity
in % ■-male1)-■-female1)
100
50
0
62
38
55
45
58
42
Staff
68
32
67
33
66
34
Professionals
76
24
76
24
71
29
Management
71
29
88
12
73
27
Executives
1) Left to right: 2011, 2012 and 2013
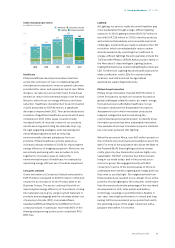
In 2013, Philips employed 35% females, a decrease of 1
percentage point compared to 2012.
Employees per age category
in % ■-male1)-■-female1)
70
35
06
8
4
7
4
6
under 25
28
33
28
33
27
32
25-35
30
31
31
31
31
32
35-45
24
20
24
20
25
21
45-55
12
8
13
9
13
9
over 55
1) Left to right: 2011, 2012 and 2013
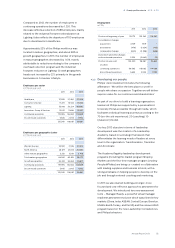
In 2013, employee turnover amounted to 16% (15% in
non-manufacturing sites; 20% in manufacturing
locations), an increase compared to 2012 caused by the
changing industrial footprint, divestments at
Healthcare, the company’s overhead reduction
program and high turnover of manufacturing sta in our
factories, mainly in the growth markets.
Employee turnover
in %
2011 2012 2013
Female 13 14 18
Male 10 13 15
Philips Group 11 14 16
Employee turnover: manufacturing vs non-manufacturing
sites
in %
2012 2013
Manufacturing sta 17 20
Non-manufacturing sta 12 15
Group 14 16
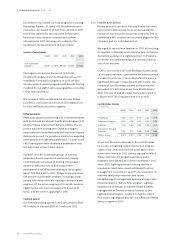
Exit diversity
in % ■-male1)-■-female1)
100
80
60
40
20
0
57
43
54
46
Staff
70
30
70
30
Professionals
82
18
79
21
Management
91
9
76
24
Executives
1) Left to right: 2012 and 2013
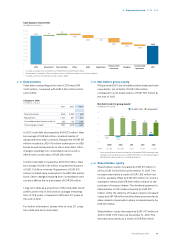
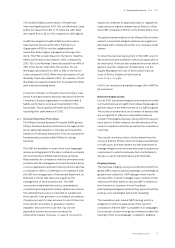
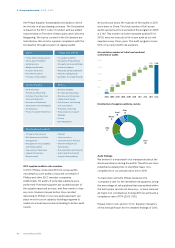
4.2.4 Employment
The total number of Philips Group employees
(Continued operations) was 114,689 at the end of 2013,
compared to 116,082 at the end of 2012. Approximately
41% were employed in the Lighting sector, due to the
continued vertical integration in this business. Some
32% were employed in the Healthcare sector and
approximately 16% in the Consumer Lifestyle sector.
Employees per sector 2013
in FTEs at year-end
Healthcare
37,008
Consumer Lifestyle
17,854
Lighting
46,890
Innovation, Group & Services
12,937