Philips 2013 Annual Report Download - page 134
Download and view the complete annual report
Please find page 134 of the 2013 Philips annual report below. You can navigate through the pages in the report by either clicking on the pages listed below, or by using the keyword search tool below to find specific information within the annual report.-
 1
1 -
2
-
3
-
4
-
5
-
6
-
7
-
8
-
9
-
10
-
11
-
12
-
13
-
14
-
15
-
16
-
17
-
18
-
19
-
20
-
21
-
22
-
23
-
24
-
25
-
26
-
27
-
28
-
29
-
30
-
31
-
32
-
33
-
34
-
35
-
36
-
37
-
38
-
39
-
40
-
41
-
42
-
43
-
44
-
45
-
46
-
47
-
48
-
49
-
50
-
51
-
52
-
53
-
54
-
55
-
56
-
57
-
58
-
59
-
60
-
61
-
62
-
63
-
64
-
65
-
66
-
67
-
68
-
69
-
70
-
71
-
72
-
73
-
74
-
75
-
76
-
77
-
78
-
79
-
80
-
81
-
82
-
83
-
84
-
85
-
86
-
87
-
88
-
89
-
90
-
91
-
92
-
93
-
94
-
95
-
96
-
97
-
98
-
99
-
100
-
101
-
102
-
103
-
104
-
105
-
106
-
107
-
108
-
109
-
110
-
111
-
112
-
113
-
114
-
115
-
116
-
117
-
118
-
119
-
120
-
121
-
122
-
123
-
 124
124 -
 125
125 -
 126
126 -
 127
127 -
 128
128 -
 129
129 -
 130
130 -
 131
131 -
 132
132 -
 133
133 -
 134
134 -
 135
135 -
 136
136 -
 137
137 -
 138
138 -
 139
139 -
 140
140 -
 141
141 -
 142
142 -
 143
143 -
 144
144 -
145
-
146
-
147
-
148
-
149
-
150
-
151
-
152
-
153
-
154
-
155
-
156
-
157
-
158
-
159
-
160
-
161
-
162
-
163
-
164
-
165
-
166
-
167
-
168
-
169
-
170
-
171
-
172
-
173
-
174
-
175
-
176
-
177
-
178
-
179
-
180
-
181
-
182
-
183
-
184
-
185
-
186
-
187
-
188
-
189
-
190
-
191
-
192
-
193
-
194
-
195
-
196
-
197
-
198
-
199
-
200
-
201
-
202
-
203
-
204
-
205
-
206
-
207
-
208
-
209
-
210
-
211
-
212
-
213
-
214
-
215
-
216
-
217
-
218
-
219
-
220
-
221
-
222
-
223
-
224
-
225
-
226
-
227
-
228
-
229
-
230
-
231
-
232
-
233
-
234
-
235
-
236
-
237
-
238
-
239
-
240
-
241
-
242
-
243
-
244
-
245
-
246
-
247
-
248
-
249
-
250
 |
 |
11 Group financial statements 11.7 - 11.7
134 Annual Report 2013
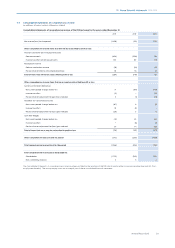
11.7 Consolidated statements of cash flows
in millions of euros
Consolidated statements of cash flows of the Philips Group for the years ended December 31
2011 2012 2013
Cash flows from operating activities
Net income (loss) (1,456) (30) 1,172
Result of discontinued operations - net of income tax 410 (47) (2)
Adjustments to reconcile net income (loss) to net cash provided by operating activities:
Depreciation, amortization, and impairments of fixed assets 1,400 1,398 1,349
Impairment of goodwill and other non-current financial assets 1,387 14 38
Net gain on sale of assets (88) (141) (54)
Loss (income) from investments in associates (14) 5 25
Dividends received from investments in associates 44 15 6
Dividends paid to non-controlling interests (4) (4) (7)
(Increase) decrease in working capital (622) 546 (1,417)
Increase in receivables and other current assets (363) (191) (530)
Increase in inventories (216) (32) (165)
(Decrease) increase in accounts payable, accrued and other current liabilities (43) 769 (722)
Increase in non-current receivables, other assets and other liabilities (425) (327) (76)
(Decrease) increase in provisions 15 429 (194)
Other items 113 224 298
Net cash provided by operating activities 760 2,082 1,138
Cash flows from investing activities
Purchase of intangible assets (69) (34) (49)
Proceeds from sale of intangible assets − 160 −
Expenditures on development assets (276) (345) (357)
Capital expenditures on property, plant and equipment (640) (661) (587)
Proceeds from sales of property, plant and equipment 128 425 27
Cash from (used for) derivatives and current financial assets
27 26 (46) (101)
Purchase of other non-current financial assets (43) (167) (13)
Proceeds from other non-current financial assets
28 87 3 15
Purchase of businesses, net of cash acquired (507) (261) (11)
Proceeds from sale of interests in businesses, net of cash disposed of 19 1 79
Net cash used for investing activities (1,275) (925) (997)
Cash flows from financing activities
Proceeds from issuance (payments) of short-term debt (217) 133 (285)
Principal payments of long-term debt (1,097) (631) (186)
Proceeds from issuance of long-term debt 454 1,228 64
Treasury shares transactions (671) (768) (562)
Dividends paid (259) (255) (272)
Net cash used for financing activities (1,790) (293) (1,241)
Net cash (used for) provided by continuing operations (2,305) 864 (1,100)