Philips 2013 Annual Report Download - page 44
Download and view the complete annual report
Please find page 44 of the 2013 Philips annual report below. You can navigate through the pages in the report by either clicking on the pages listed below, or by using the keyword search tool below to find specific information within the annual report.-
 1
1 -
2
-
3
-
4
-
5
-
6
-
7
-
8
-
9
-
10
-
11
-
12
-
13
-
14
-
15
-
16
-
17
-
18
-
19
-
20
-
21
-
22
-
23
-
24
-
25
-
26
-
27
-
28
-
29
-
30
-
31
-
32
-
33
-
 34
34 -
 35
35 -
 36
36 -
 37
37 -
 38
38 -
 39
39 -
 40
40 -
 41
41 -
 42
42 -
 43
43 -
 44
44 -
 45
45 -
 46
46 -
 47
47 -
 48
48 -
 49
49 -
 50
50 -
 51
51 -
 52
52 -
 53
53 -
 54
54 -
55
-
56
-
57
-
58
-
59
-
60
-
61
-
62
-
63
-
64
-
65
-
66
-
67
-
68
-
69
-
70
-
71
-
72
-
73
-
74
-
75
-
76
-
77
-
78
-
79
-
80
-
81
-
82
-
83
-
84
-
85
-
86
-
87
-
88
-
89
-
90
-
91
-
92
-
93
-
94
-
95
-
96
-
97
-
98
-
99
-
100
-
101
-
102
-
103
-
104
-
105
-
106
-
107
-
108
-
109
-
110
-
111
-
112
-
113
-
114
-
115
-
116
-
117
-
118
-
119
-
120
-
121
-
122
-
123
-
124
-
125
-
126
-
127
-
128
-
129
-
130
-
131
-
132
-
133
-
134
-
135
-
136
-
137
-
138
-
139
-
140
-
141
-
142
-
143
-
144
-
145
-
146
-
147
-
148
-
149
-
150
-
151
-
152
-
153
-
154
-
155
-
156
-
157
-
158
-
159
-
160
-
161
-
162
-
163
-
164
-
165
-
166
-
167
-
168
-
169
-
170
-
171
-
172
-
173
-
174
-
175
-
176
-
177
-
178
-
179
-
180
-
181
-
182
-
183
-
184
-
185
-
186
-
187
-
188
-
189
-
190
-
191
-
192
-
193
-
194
-
195
-
196
-
197
-
198
-
199
-
200
-
201
-
202
-
203
-
204
-
205
-
206
-
207
-
208
-
209
-
210
-
211
-
212
-
213
-
214
-
215
-
216
-
217
-
218
-
219
-
220
-
221
-
222
-
223
-
224
-
225
-
226
-
227
-
228
-
229
-
230
-
231
-
232
-
233
-
234
-
235
-
236
-
237
-
238
-
239
-
240
-
241
-
242
-
243
-
244
-
245
-
246
-
247
-
248
-
249
-
250
 |
 |

4 Group performance 4.1.7 - 4.1.9
44 Annual Report 2013
For further information on restructuring, refer to note 21,
Provisions.
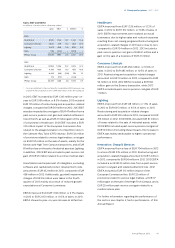
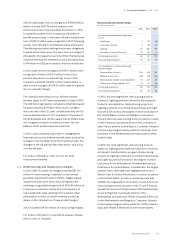
4.1.7 Financial income and expenses
A breakdown of Financial income and expenses is
presented in the table below.
Financial income and expenses
in millions of euros
2011 2012 2013
Interest expense (net) (302) (325) (268)
Sale of securities 51 1 −
Impairments (34) (8) (10)
Other (46) 3 (52)
(331) (329) (330)
The net interest expense in 2013 was EUR 57 million
lower than in 2012, mainly as a result of lower average
outstanding debt and interest related to pensions in
2013.
Other financial income was a EUR 52 million loss in
2013, primarily consisting of a EUR 25 million accretion
expense (mainly associated with discounted
provisions) and EUR 24 million of other financing
charges.
Other financial income was a EUR 3 million gain in 2012,
primarily consisting of a EUR 46 million gain related to a
change in estimate on the valuation of long-term
derivative contracts and remaining other financial
income of EUR 20 million. This was oset by a EUR 22
million accretion expense (mainly associated with
discounted provisions) and EUR 41 million other
financing charges.
Impairments
in millions of euros
2011 2012 2013
TPV (25) − −
Chi-Mei Innolux (4) (1) (1)
BG Medicine (2) (1) (1)
Prime Technology (1) − −
Tendris − (5) (1)
Gilde III − (1) (2)
Lighting Science Group − − (3)
Other (2) − (2)
(34) (8) (10)
Impairment charges in 2013 amounted to EUR 10
million, mainly from shareholdings in Lighting Science
Group and Gilde III. In 2012, impairment charges
amounted to EUR 8 million, mainly from shareholdings
in Tendris.
For further information, refer to note 4, Financial
income and expenses.
4.1.8 Income taxes
Income taxes amounted to EUR 466 million, compared
to EUR 185 million in 2012. The eective income tax rate
was 28.1%, compared to 58.0% in 2012. Excluding the
non-tax-deductible European Commission fine and
charges related to various legal matters in 2012, the
eective tax rate in 2012 was 25.5%. The 2.6 percentage
points increase in 2013 was mainly related to a higher
weighted average statutory income tax rate in 2013 due
to a change in the country mix of profit and loss, which
was partly oset by lower valuation allowances.
For 2014, the eective tax rate excluding incidental
non-taxable items is expected to be between 30% and
32%.
For further information, refer to note 5, Income taxes.
4.1.9 Results of investments in associates
The results related to investments in associates
improved from a loss of EUR 211 million in 2012 to a loss
of EUR 25 million in 2013, largely attributable to a
charge of EUR 196 million related to the former
LG.Philips Displays joint venture in 2012.
The European Commission imposed fines in relation to
alleged violations of competition rules in the Cathode-
Ray Tube industry. Philips recorded a total charge of
EUR 509 million, of which EUR 313 million was directly
related to Philips and therefore recorded in Income
from operations, while EUR 196 million related to
LG.Philips Displays and was therefore recorded in
Results of investments in associates.
Results of investments in associates
in millions of euros
2011 2012 2013
Company’s participation in income 18 (5) 5
Investment impairment and other
charges (3) (206) (30)
15 (211) (25)