Philips 2013 Annual Report Download - page 41
Download and view the complete annual report
Please find page 41 of the 2013 Philips annual report below. You can navigate through the pages in the report by either clicking on the pages listed below, or by using the keyword search tool below to find specific information within the annual report.-
 1
1 -
2
-
3
-
4
-
5
-
6
-
7
-
8
-
9
-
10
-
11
-
12
-
13
-
14
-
15
-
16
-
17
-
18
-
19
-
20
-
21
-
22
-
23
-
24
-
25
-
26
-
27
-
28
-
29
-
30
-
 31
31 -
 32
32 -
 33
33 -
 34
34 -
 35
35 -
 36
36 -
 37
37 -
 38
38 -
 39
39 -
 40
40 -
 41
41 -
 42
42 -
 43
43 -
 44
44 -
 45
45 -
 46
46 -
 47
47 -
 48
48 -
 49
49 -
 50
50 -
 51
51 -
52
-
53
-
54
-
55
-
56
-
57
-
58
-
59
-
60
-
61
-
62
-
63
-
64
-
65
-
66
-
67
-
68
-
69
-
70
-
71
-
72
-
73
-
74
-
75
-
76
-
77
-
78
-
79
-
80
-
81
-
82
-
83
-
84
-
85
-
86
-
87
-
88
-
89
-
90
-
91
-
92
-
93
-
94
-
95
-
96
-
97
-
98
-
99
-
100
-
101
-
102
-
103
-
104
-
105
-
106
-
107
-
108
-
109
-
110
-
111
-
112
-
113
-
114
-
115
-
116
-
117
-
118
-
119
-
120
-
121
-
122
-
123
-
124
-
125
-
126
-
127
-
128
-
129
-
130
-
131
-
132
-
133
-
134
-
135
-
136
-
137
-
138
-
139
-
140
-
141
-
142
-
143
-
144
-
145
-
146
-
147
-
148
-
149
-
150
-
151
-
152
-
153
-
154
-
155
-
156
-
157
-
158
-
159
-
160
-
161
-
162
-
163
-
164
-
165
-
166
-
167
-
168
-
169
-
170
-
171
-
172
-
173
-
174
-
175
-
176
-
177
-
178
-
179
-
180
-
181
-
182
-
183
-
184
-
185
-
186
-
187
-
188
-
189
-
190
-
191
-
192
-
193
-
194
-
195
-
196
-
197
-
198
-
199
-
200
-
201
-
202
-
203
-
204
-
205
-
206
-
207
-
208
-
209
-
210
-
211
-
212
-
213
-
214
-
215
-
216
-
217
-
218
-
219
-
220
-
221
-
222
-
223
-
224
-
225
-
226
-
227
-
228
-
229
-
230
-
231
-
232
-
233
-
234
-
235
-
236
-
237
-
238
-
239
-
240
-
241
-
242
-
243
-
244
-
245
-
246
-
247
-
248
-
249
-
250
 |
 |
4 Group performance 4.1.2 - 4.1.2
Annual Report 2013 41
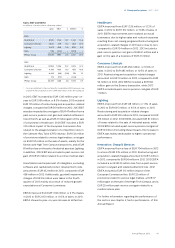
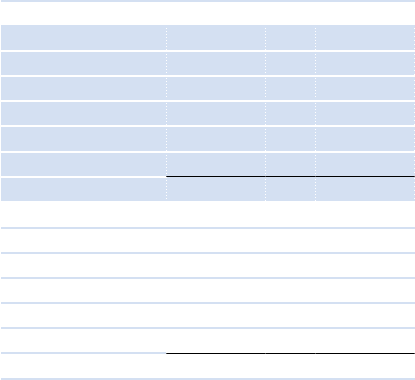
Sales, EBIT and EBITA
in millions of euros unless otherwise stated
sales EBIT % EBITA1) %
2013
Healthcare 9,575 1,315 13.7 1,512 15.8
Consumer Lifestyle 4,605 429 9.3 483 10.5
Lighting 8,413 489 5.8 695 8.3
IG&S 736 (242) − (239) −
Philips Group 23,329 1,991 8.5 2,451 10.5
2012
Healthcare 9,983 1,026 10.3 1,226 12.3
Consumer Lifestyle 4,319 400 9.3 456 10.6
Lighting 8,442 (66) (0.8) 128 1.5
IG&S 713 (712) − (704) −
Philips Group 23,457 648 2.8 1,106 4.7
1) For a reconciliation to the most directly comparable GAAP measures, see
chapter 14, Reconciliation of non-GAAP information, of this Annual Report
In 2013, EBIT increased by EUR 1,343 million year-on-
year to EUR 1,991 million, or 8.5% of sales. 2013 included
EUR 117 million of restructuring and acquisition-related
charges, compared to EUR 561 million in 2012. 2013 EBIT
was also impacted by a net gain of EUR 47 million from a
past-service pension cost gain and related settlement
loss in the US, as well as a EUR 21 million gain on the sale
of a business in Healthcare. 2012 EBIT included a EUR
313 million impact of the European Commission fine
related to the alleged violation of competition rules in
the Cathode-Ray Tube (CRT) industry, EUR 132 million
of provisions related to various legal matters, a net gain
on EUR 197 million on the sale of assets, mainly for the
Senseo and High Tech Campus transactions, and a EUR
81 million loss on the sale of industrial assets at Lighting.
In addition, 2012 EBIT also included a past-service cost
gain of EUR 25 million related to a retiree medical plan.
Amortization and impairment of intangibles, excluding
software and capitalized product development costs,
amounted to EUR 432 million in 2013, compared to EUR
458 million in 2012. Additionally, goodwill impairment
charges of EUR 26 million were taken in the fourth
quarter of 2013 mainly as a result of reduced growth
expectations at Consumer Luminaires.
EBITA improved from EUR 1,106 million, or 4.7% of sales,
in 2012 to EUR 2,451 million, or 10.5% of sales, in 2013.
EBITA showed a year-on-year increase at all Sectors.
Healthcare
EBITA improved from EUR 1,226 million, or 12.3% of
sales, in 2012 to EUR 1,512 million, or 15.8% of sales, in
2013. EBITA improvements were realized across all
businesses, due to higher sales and reduced expenses
resulting from cost-saving programs. Restructuring and
acquisition-related charges in 2013 were close to zero,
compared to EUR 134 million in 2012. 2013 included a
past-service pension cost gain of EUR 61 million and a
gain on the sale of a business of EUR 21 million.
Consumer Lifestyle
EBITA improved from EUR 456 million, or 10.6% of
sales, in 2012 to EUR 483 million, or 10.5% of sales, in
2013. Restructuring and acquisition-related charges
amounted to EUR 14 million in 2013, compared to EUR
56 million in 2012. 2012 EBITA included a EUR 160
million gain on the Senseo transaction, while 2013
EBITA included a past-service pension cost gain of EUR
1 million.
Lighting
EBITA improved from EUR 128 million, or 1.5% of sales,
in 2012 to EUR 695 million, or 8.3% of sales, in 2013.
Restructuring and acquisition-related charges
amounted to EUR 100 million in 2013, compared to EUR
315 million in 2012. 2012 EBITA included EUR 81 million
of losses related to the sale of industrial assets, while
2013 EBITA included a past-service pension cost gain of
EUR 10 million. Excluding these impacts, the increase in
EBITA was mainly attributable to higher operational
performance.
Innovation, Group & Services
EBITA improved from a loss of EUR 704 million in 2012
to a loss of EUR 239 million in 2013. Restructuring and
acquisition-related charges amounted to EUR 3 million
in 2013, compared to EUR 56 million in 2012. 2013 EBITA
included a net EUR 25 million loss from a past-service
pension cost gain and related settlement loss. 2012
EBITA included a EUR 313 million impact of the
European Commission fine, EUR 132 million of
provisions related to various legal matters, a EUR 37
million gain on the sale of the High Tech Campus, and a
EUR 25 million past-service cost gain related to a
medical retiree plan.
For further information regarding the performance of
the sectors, see chapter 5, Sector performance, of this
Annual Report.