Philips 2013 Annual Report Download - page 55
Download and view the complete annual report
Please find page 55 of the 2013 Philips annual report below. You can navigate through the pages in the report by either clicking on the pages listed below, or by using the keyword search tool below to find specific information within the annual report.-
 1
1 -
2
-
3
-
4
-
5
-
6
-
7
-
8
-
9
-
10
-
11
-
12
-
13
-
14
-
15
-
16
-
17
-
18
-
19
-
20
-
21
-
22
-
23
-
24
-
25
-
26
-
27
-
28
-
29
-
30
-
31
-
32
-
33
-
34
-
35
-
36
-
37
-
38
-
39
-
40
-
41
-
42
-
43
-
44
-
 45
45 -
 46
46 -
 47
47 -
 48
48 -
 49
49 -
 50
50 -
 51
51 -
 52
52 -
 53
53 -
 54
54 -
 55
55 -
 56
56 -
 57
57 -
 58
58 -
 59
59 -
 60
60 -
 61
61 -
 62
62 -
 63
63 -
 64
64 -
 65
65 -
66
-
67
-
68
-
69
-
70
-
71
-
72
-
73
-
74
-
75
-
76
-
77
-
78
-
79
-
80
-
81
-
82
-
83
-
84
-
85
-
86
-
87
-
88
-
89
-
90
-
91
-
92
-
93
-
94
-
95
-
96
-
97
-
98
-
99
-
100
-
101
-
102
-
103
-
104
-
105
-
106
-
107
-
108
-
109
-
110
-
111
-
112
-
113
-
114
-
115
-
116
-
117
-
118
-
119
-
120
-
121
-
122
-
123
-
124
-
125
-
126
-
127
-
128
-
129
-
130
-
131
-
132
-
133
-
134
-
135
-
136
-
137
-
138
-
139
-
140
-
141
-
142
-
143
-
144
-
145
-
146
-
147
-
148
-
149
-
150
-
151
-
152
-
153
-
154
-
155
-
156
-
157
-
158
-
159
-
160
-
161
-
162
-
163
-
164
-
165
-
166
-
167
-
168
-
169
-
170
-
171
-
172
-
173
-
174
-
175
-
176
-
177
-
178
-
179
-
180
-
181
-
182
-
183
-
184
-
185
-
186
-
187
-
188
-
189
-
190
-
191
-
192
-
193
-
194
-
195
-
196
-
197
-
198
-
199
-
200
-
201
-
202
-
203
-
204
-
205
-
206
-
207
-
208
-
209
-
210
-
211
-
212
-
213
-
214
-
215
-
216
-
217
-
218
-
219
-
220
-
221
-
222
-
223
-
224
-
225
-
226
-
227
-
228
-
229
-
230
-
231
-
232
-
233
-
234
-
235
-
236
-
237
-
238
-
239
-
240
-
241
-
242
-
243
-
244
-
245
-
246
-
247
-
248
-
249
-
250
 |
 |

4 Group performance 4.2.5 - 4.2.5
Annual Report 2013 55
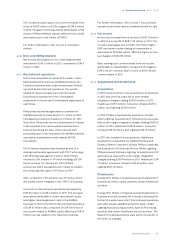
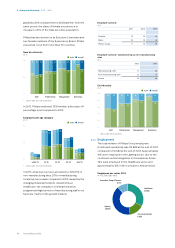
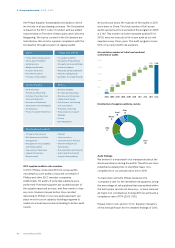
Compared to 2012, the number of employees in
continuing operations decreased by 1,393. This
decrease reflects a reduction of 688 employees, mainly
related to the industrial footprint rationalization at
Lighting. It also reflects the departure of 705 employees
due to divestments in Healthcare.
Approximately 52% of the Philips workforce was
located in mature geographies, and about 48% in
growth geographies. In 2013, the number of employees
in mature geographies decreased by 1,614, mainly
attributable to reductions relating to the company’s
overhead reduction program and the industrial
footprint reduction in Lighting. Growth geographies
headcount increased by 221, primarily in the growth
businesses in Consumer Lifestyle.
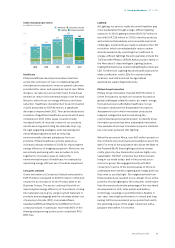
Employees per sector
in FTEs at year-end
2011 2012 2013
Healthcare 37,955 37,460 37,008
Consumer Lifestyle 15,471 16,542 17,854
Lighting 53,168 50,224 46,890
Innovation, Group & Services 13,001 11,856 12,937
Continuing operations 119,595 116,082 114,689
Discontinued operations 5,645 2,005 1,992
125,240 118,087 116,681
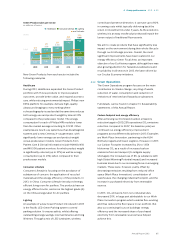
Employees per geographic cluster
in FTEs at year-end
2011 2012 2013
Western Europe 32,901 31,126 30,514
North America 28,129 26,134 25,080
Other mature geographies 3,232 3,359 3,478
Total mature geographies 64,262 60,619 59,072
Growth geographies 55,333 55,463 55,617
Continuing operations 119,595 116,082 114,689
Discontinued operations 5,645 2,005 1,992
125,240 118,087 116,681
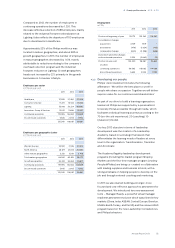
Employment
in FTEs
2011 2012 2013
Position at beginning of year 119,775 125,240 118,087
Consolidation changes:
acquisitions 4,759 909 −
divestments (479) (1,024) (705)
comparable changes (850) (3,398) (688)
Divestment and other changes
in discontinued operations 2,035 (3,640) (13)
Position at year-end 125,240 118,087 116,681
of which:
continuing operations 119,595 116,082 114,689
discontinued operations 5,645 2,005 1,992
4.2.5 Developing our people
Philips’ vision statement includes the following
affirmation: “We will be the best place to work for
people who share our passion. Together we will deliver
superior value for our customers and shareholders.”
As part of our drive to build a learning organization,
learners at Philips are supported by a personalized
University Portal accessible through all media, which
facilitates individual learning journeys according to the
70 (on-the-job experience): 20 (coaching): 10
(classroom) model.
Our key 2013 objective in terms of leadership
development was the creation of a Leadership
Academy, based on a strategic framework that
dierentiates the learning needs of leaders at every
level in the organization: Transformation, Transition
and Accelerate.
The Academy flagship leadership development
programs (including the market program Shaping
Markets and the
first-time manager program Leading
People@Philips) are being co-created in collaboration
with leading suppliers and business schools, with a
strong emphasis on helping people to develop on the
job and through external coaching and mentoring.
In 2013 we also started building a stronger, more
focused and cost-eective approach to assessment for
development. We introduced two new assessment
tools – Manager Ready, a powerful virtual manager
readiness assessment solution which was piloted in key
markets (China, India, ASEAN, Central Europe, Benelux,
Middle East & Turkey, and the US) and the renewed 360
program based on the new Leadership Competencies
and Philips behaviors.