Philips 2013 Annual Report Download - page 49
Download and view the complete annual report
Please find page 49 of the 2013 Philips annual report below. You can navigate through the pages in the report by either clicking on the pages listed below, or by using the keyword search tool below to find specific information within the annual report.-
 1
1 -
2
-
3
-
4
-
5
-
6
-
7
-
8
-
9
-
10
-
11
-
12
-
13
-
14
-
15
-
16
-
17
-
18
-
19
-
20
-
21
-
22
-
23
-
24
-
25
-
26
-
27
-
28
-
29
-
30
-
31
-
32
-
33
-
34
-
35
-
36
-
37
-
38
-
 39
39 -
 40
40 -
 41
41 -
 42
42 -
 43
43 -
 44
44 -
 45
45 -
 46
46 -
 47
47 -
 48
48 -
 49
49 -
 50
50 -
 51
51 -
 52
52 -
 53
53 -
 54
54 -
 55
55 -
 56
56 -
 57
57 -
 58
58 -
 59
59 -
60
-
61
-
62
-
63
-
64
-
65
-
66
-
67
-
68
-
69
-
70
-
71
-
72
-
73
-
74
-
75
-
76
-
77
-
78
-
79
-
80
-
81
-
82
-
83
-
84
-
85
-
86
-
87
-
88
-
89
-
90
-
91
-
92
-
93
-
94
-
95
-
96
-
97
-
98
-
99
-
100
-
101
-
102
-
103
-
104
-
105
-
106
-
107
-
108
-
109
-
110
-
111
-
112
-
113
-
114
-
115
-
116
-
117
-
118
-
119
-
120
-
121
-
122
-
123
-
124
-
125
-
126
-
127
-
128
-
129
-
130
-
131
-
132
-
133
-
134
-
135
-
136
-
137
-
138
-
139
-
140
-
141
-
142
-
143
-
144
-
145
-
146
-
147
-
148
-
149
-
150
-
151
-
152
-
153
-
154
-
155
-
156
-
157
-
158
-
159
-
160
-
161
-
162
-
163
-
164
-
165
-
166
-
167
-
168
-
169
-
170
-
171
-
172
-
173
-
174
-
175
-
176
-
177
-
178
-
179
-
180
-
181
-
182
-
183
-
184
-
185
-
186
-
187
-
188
-
189
-
190
-
191
-
192
-
193
-
194
-
195
-
196
-
197
-
198
-
199
-
200
-
201
-
202
-
203
-
204
-
205
-
206
-
207
-
208
-
209
-
210
-
211
-
212
-
213
-
214
-
215
-
216
-
217
-
218
-
219
-
220
-
221
-
222
-
223
-
224
-
225
-
226
-
227
-
228
-
229
-
230
-
231
-
232
-
233
-
234
-
235
-
236
-
237
-
238
-
239
-
240
-
241
-
242
-
243
-
244
-
245
-
246
-
247
-
248
-
249
-
250
 |
 |

4 Group performance 4.1.19 - 4.1.21
Annual Report 2013 49
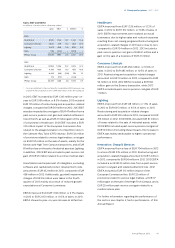
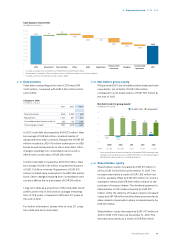
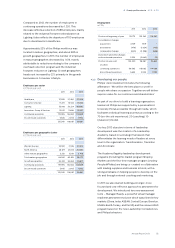
Cash balance movements
in millions of euros
4,500
4,000
3,500
3,000
2,500
2,000
1,500
1,000
500
0
3,834
2012
94
Divestments1)
172
Free cash flow2)
(164)
Other3)
(407)
Debt
(24)
Acquisitions
(562)
Treasury share
transaction
(272)
Dividend
(206)
Discontinued
operations
2,465
2013
1) Includes proceeds from divestment of Profile Pharma and Raytel Cardiac
2) Please refer to chapter 14, Reconciliation of non-GAAP information, of this Annual Report
3) Includes cash flow for derivatives and currency eect
4.1.19 Debt position
Total debt outstanding at the end of 2013 was EUR
3,901 million, compared with EUR 4,534 million at the
end of 2012.
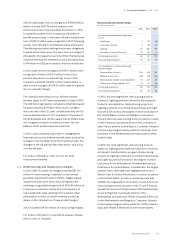
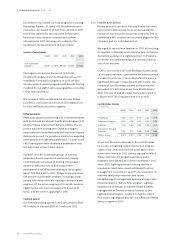
Changes in debt
in millions of euros
2011 2012 2013
New borrowings (454) (1,361) (64)
Repayments 1,314 631 471
Consolidation and currency eects (62) 56 226
Total changes in debt 798 (674) 633
In 2013, total debt decreased by EUR 633 million. New
borrowings of EUR 64 million consisted mainly of
replacements to lease contracts. Repayment of EUR 471
million included a USD 143 million redemption on USD
bonds as well as payments on short-term debt. Other
changes resulting from consolidation and currency
eects led to a decrease of EUR 226 million.
In 2012, total debt increased by EUR 674 million. New
borrowings of EUR 1,361 million included the issuance
of USD 1.5 billion in bonds. Repayment of EUR 631
million included early redemption of a USD 500 million
bond. Other changes resulting from consolidation and
currency eects led to a decrease of EUR 56 million.
Long-term debt as a proportion of the total debt stood
at 85% at the end of 2013 with an average remaining
term of 12.8 years, compared to 82% and 12.7 years at
the end of 2012.
For further information, please refer to note 20, Long-
term debt and short-term debt.
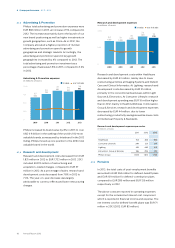
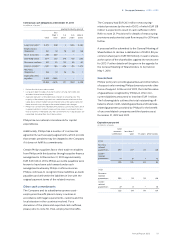
4.1.20 Net debt to group equity
Philips ended 2013 in a net debt position (cash and cash
equivalents, net of debt) of EUR 1,436 million,
compared to a net debt position of EUR 700 million at
the end of 2012.
Net debt (cash) to group equity1)
in billions of euros ■-net debt (cash)--■-group equity2)
20
15
10
5
0
(5)
(0.1)
14.6
(1) : 101
2009
(1.2)
15.1
(8) : 108
2010
0.7
12.4
5 : 95
2011
0.7
11.2
6 : 94
2012
1.4
11.2
11 : 89
2013
ratio:
1) For a reconciliation to the most directly comparable GAAP measures, see
chapter 14, Reconciliation of non-GAAP information, of this Annual Report
2) Shareholders’ equity and non-controlling interests
4.1.21 Shareholders’ equity
Shareholders’ equity increased by EUR 63 million in
2013 to EUR 11,214 million at December 31, 2013. The
increase was mainly a result of EUR 1,169 million net
income, partially oset by EUR 476 million of currency
translation losses and EUR 669 million related to the
purchase of treasury shares. The dividend payment to
shareholders in 2013 reduced equity by EUR 272
million, while the delivery of treasury shares increased
equity by EUR 118 million and the share premium due to
share-based compensation plans increased equity by
EUR 105 million.
Shareholders’ equity decreased by EUR 1,177 million in
2012 to EUR 11,151 million at December 31, 2012. The
decrease was mainly as a result of EUR 816 million