Philips 2013 Annual Report Download - page 53
Download and view the complete annual report
Please find page 53 of the 2013 Philips annual report below. You can navigate through the pages in the report by either clicking on the pages listed below, or by using the keyword search tool below to find specific information within the annual report.-
 1
1 -
2
-
3
-
4
-
5
-
6
-
7
-
8
-
9
-
10
-
11
-
12
-
13
-
14
-
15
-
16
-
17
-
18
-
19
-
20
-
21
-
22
-
23
-
24
-
25
-
26
-
27
-
28
-
29
-
30
-
31
-
32
-
33
-
34
-
35
-
36
-
37
-
38
-
39
-
40
-
41
-
42
-
 43
43 -
 44
44 -
 45
45 -
 46
46 -
 47
47 -
 48
48 -
 49
49 -
 50
50 -
 51
51 -
 52
52 -
 53
53 -
 54
54 -
 55
55 -
 56
56 -
 57
57 -
 58
58 -
 59
59 -
 60
60 -
 61
61 -
 62
62 -
 63
63 -
64
-
65
-
66
-
67
-
68
-
69
-
70
-
71
-
72
-
73
-
74
-
75
-
76
-
77
-
78
-
79
-
80
-
81
-
82
-
83
-
84
-
85
-
86
-
87
-
88
-
89
-
90
-
91
-
92
-
93
-
94
-
95
-
96
-
97
-
98
-
99
-
100
-
101
-
102
-
103
-
104
-
105
-
106
-
107
-
108
-
109
-
110
-
111
-
112
-
113
-
114
-
115
-
116
-
117
-
118
-
119
-
120
-
121
-
122
-
123
-
124
-
125
-
126
-
127
-
128
-
129
-
130
-
131
-
132
-
133
-
134
-
135
-
136
-
137
-
138
-
139
-
140
-
141
-
142
-
143
-
144
-
145
-
146
-
147
-
148
-
149
-
150
-
151
-
152
-
153
-
154
-
155
-
156
-
157
-
158
-
159
-
160
-
161
-
162
-
163
-
164
-
165
-
166
-
167
-
168
-
169
-
170
-
171
-
172
-
173
-
174
-
175
-
176
-
177
-
178
-
179
-
180
-
181
-
182
-
183
-
184
-
185
-
186
-
187
-
188
-
189
-
190
-
191
-
192
-
193
-
194
-
195
-
196
-
197
-
198
-
199
-
200
-
201
-
202
-
203
-
204
-
205
-
206
-
207
-
208
-
209
-
210
-
211
-
212
-
213
-
214
-
215
-
216
-
217
-
218
-
219
-
220
-
221
-
222
-
223
-
224
-
225
-
226
-
227
-
228
-
229
-
230
-
231
-
232
-
233
-
234
-
235
-
236
-
237
-
238
-
239
-
240
-
241
-
242
-
243
-
244
-
245
-
246
-
247
-
248
-
249
-
250
 |
 |

4 Group performance 4.2.2 - 4.2.3
Annual Report 2013 53
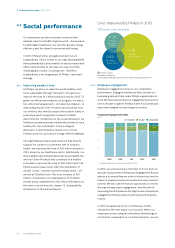
that 75% of our employees provided a favorable
response to our new engagement index, 3 points above
the external high-performing benchmark. This is a very
encouraging result; especially given the speed and
scale of our current transformation.
The survey results indicate the following areas as
strengths:
• Clarity of strategic direction provided by senior
leadership
• Adopting good ideas from all over the company
• Making good use of skills and abilities
• Providing opportunities for employees to grow and
develop
• Senior leaders’ belief in the future of Philips
There are also improvement areas:
• Making the changes necessary to compete
eectively and applying these changes in a
consistent manner
• Ability as an organization to fix problems so they
don’t happen again
• Senior leaders have to do more to ensure we drive
collaboration, execution and improvement across
organizational boundaries
• Focus on customers must continue to strengthen
• Need to create a diverse workforce and inclusive
culture where people of all backgrounds can succeed
in Philips
Engagement is now an integral part of how we build our
culture and is an ingredient in a broader portfolio of
initiatives and measurement tools. For example, in our
end-to-end transformations, we use surveys to ensure
forward progress while creating opportunities for team
dialogues. We will use shorter, targeted surveys and
dialogue platforms to maintain focus on key areas until
the next full-census employee survey in 2015.
4.2.3 Diversity and inclusion
We set measurable objectives for achieving diversity
and inclusion within Philips. Measuring performance
against defined metrics twice annually, Executive
Committee members hold their organizations
accountable for progress and review actions and
outcomes as part of business reviews.
With the roll-out of a revised Diversity and Inclusion
(D&I) strategy and the launch of a new global D&I policy
in 2013, Philips has taken major steps to clearly anchor
diversity and inclusion as priorities and to engage all
employees and leaders in contributing to an inclusive
work environment. This policy prescribes:
• Championing workforce diversity. We embrace
unique individuals regardless of race, color, age,
gender, gender identity or expression, sexual
orientation, language, religion, political or other
opinion, disability, national or social origin or birth.
• Valuing diverse perspectives. We leverage the
diverse thinking, skills, experience and working styles
of everyone in our company.
• Building a flexible organization. We provide
opportunities for work arrangements that
accommodate the diverse needs of people at
dierent career and life stages.
• Respecting stakeholder diversity. We develop strong
and sustainable relationships with diverse
stakeholders including customers, communities,
governments, suppliers and shareholders.
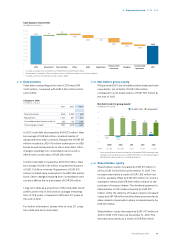
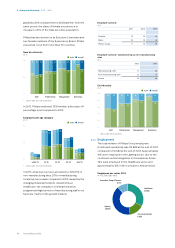
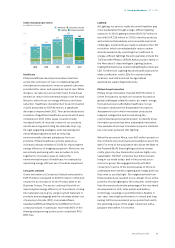
Gender diversity
in % ■-male1)-■-female1)
100
50
0
57
43
57
43
58
42
Staff
72
28
71
29
71
29
Professionals
82
18
82
18
81
19
Management
87
13
86
14
85
15
Executives
1) Left to right: 2011, 2012 and 2013
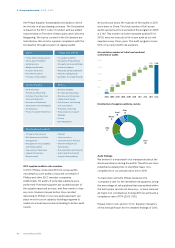
Progress has been made in ensuring a better
representation of women in leadership roles: women
now constitute 15% of Philips’ executive population, an
increase of 1 percentage point year-on-year. Also, we
have been appointing more local leaders: at year-end
2013, over 75% of senior leaders in countries were of
local origin.
Going forward, driving D&I remains a priority for Philips.
While female representation has also increased at
professional and management level, Philips has made
this an attention point for the coming year as well,
recognizing that this is necessary in order to strengthen
the leadership pipeline and create a strong basis for
sustainable change. Therefore, a commitment has been
made to increase the share of women in corporate
grades 70 – 90 (refer to professionals and management
category in the graphs) by 5 percentage points (per