Philips 2013 Annual Report Download - page 46
Download and view the complete annual report
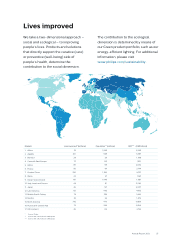
Please find page 46 of the 2013 Philips annual report below. You can navigate through the pages in the report by either clicking on the pages listed below, or by using the keyword search tool below to find specific information within the annual report.-
 1
1 -
2
-
3
-
4
-
5
-
6
-
7
-
8
-
9
-
10
-
11
-
12
-
13
-
14
-
15
-
16
-
17
-
18
-
19
-
20
-
21
-
22
-
23
-
24
-
25
-
26
-
27
-
28
-
29
-
30
-
31
-
32
-
33
-
34
-
35
-
 36
36 -
 37
37 -
 38
38 -
 39
39 -
 40
40 -
 41
41 -
 42
42 -
 43
43 -
 44
44 -
 45
45 -
 46
46 -
 47
47 -
 48
48 -
 49
49 -
 50
50 -
 51
51 -
 52
52 -
 53
53 -
 54
54 -
 55
55 -
 56
56 -
57
-
58
-
59
-
60
-
61
-
62
-
63
-
64
-
65
-
66
-
67
-
68
-
69
-
70
-
71
-
72
-
73
-
74
-
75
-
76
-
77
-
78
-
79
-
80
-
81
-
82
-
83
-
84
-
85
-
86
-
87
-
88
-
89
-
90
-
91
-
92
-
93
-
94
-
95
-
96
-
97
-
98
-
99
-
100
-
101
-
102
-
103
-
104
-
105
-
106
-
107
-
108
-
109
-
110
-
111
-
112
-
113
-
114
-
115
-
116
-
117
-
118
-
119
-
120
-
121
-
122
-
123
-
124
-
125
-
126
-
127
-
128
-
129
-
130
-
131
-
132
-
133
-
134
-
135
-
136
-
137
-
138
-
139
-
140
-
141
-
142
-
143
-
144
-
145
-
146
-
147
-
148
-
149
-
150
-
151
-
152
-
153
-
154
-
155
-
156
-
157
-
158
-
159
-
160
-
161
-
162
-
163
-
164
-
165
-
166
-
167
-
168
-
169
-
170
-
171
-
172
-
173
-
174
-
175
-
176
-
177
-
178
-
179
-
180
-
181
-
182
-
183
-
184
-
185
-
186
-
187
-
188
-
189
-
190
-
191
-
192
-
193
-
194
-
195
-
196
-
197
-
198
-
199
-
200
-
201
-
202
-
203
-
204
-
205
-
206
-
207
-
208
-
209
-
210
-
211
-
212
-
213
-
214
-
215
-
216
-
217
-
218
-
219
-
220
-
221
-
222
-
223
-
224
-
225
-
226
-
227
-
228
-
229
-
230
-
231
-
232
-
233
-
234
-
235
-
236
-
237
-
238
-
239
-
240
-
241
-
242
-
243
-
244
-
245
-
246
-
247
-
248
-
249
-
250
 |
 |

4 Group performance 4.1.13 - 4.1.15
46 Annual Report 2013
In 2012, Philips agreed to extend its partnership with
Sara Lee Corp (Sara Lee) to drive growth in the global
coee market. Under a new exclusive partnership
framework, which will run through to 2020, Philips will
be the exclusive Senseo consumer appliance
manufacturer and distributor for the duration of the
agreement. As part of the agreement, Philips divested
its 50% ownership right in the Senseo trademark to Sara
Lee.
In 2011, Philips completed several divestments, of
which Assembléon was the most significant. Philips
sold 80% of the shares in Assembléon to H2 Equity
Partners, an Amsterdam-based private equity firm, for a
consideration of EUR 14 million.
For details, please refer to note 9, Acquisitions and
divestments.
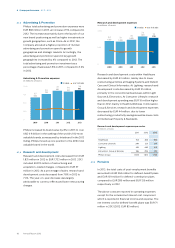
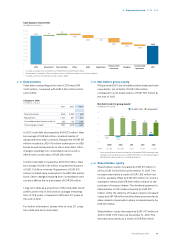
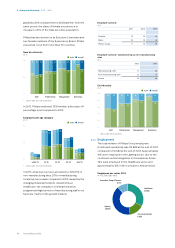
4.1.14 Performance by geographic cluster
In 2013, sales grew 3% on a comparable basis (-1%
nominally), driven by growth at Consumer Lifestyle,
notably in growth geographies.
Comparable sales growth by geographic cluster1)
in %
■-Philips Group--■-growth geographies--■-mature geographies
15
10
5
0
(5)
5.8
12.4
2.9
2011
5.7
12.5
2.4
2012
3.3
10.7
(0.5)
2013
1) For a reconciliation to the most directly comparable GAAP measures, see
chapter 14, Reconciliation of non-GAAP information, of this Annual Report
Sales in mature geographies were EUR 582 million
lower than in 2012, or 1% lower on a comparable basis.
Sales in Western Europe were impacted by
macroeconomic developments and were flat on a
comparable basis. Growth at Lighting and Consumer
Lifestyle was oset by a decline at Healthcare. Sales in
North America declined by EUR 429 million or 2% lower
on a comparable basis, mainly due to declines at
Healthcare and Lighting. Both nominal and comparable
sales in other mature geographies showed strong
growth. Comparable sales in other mature geographies
showed mid-single-digit growth, mainly driven by
strong performance at Consumer Lifestyle and
Healthcare.
In growth geographies, sales grew by EUR 454 million,
or 11% on a comparable basis, driven by double-digit
growth at Consumer Lifestyle and Lighting. In China and
Latin America, we achieved solid double-digit nominal
and comparable growth.
Sales per geographic cluster
in millions of euros
■-Western Europe_■-North America_■-other mature_■-growth
30,000
20,000
10,000
0
2011
5,716
6,748
1,708
6,820
20,992
2012
5,872
7,470
2,065
8,050
23,457
2013
5,871
7,041
1,913
8,504
23,329
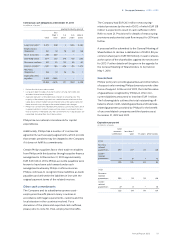
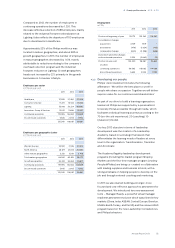
4.1.15 Cash flows provided by continuing operations
Cash flows from operating activities
Net cash flow from operating activities amounted to
EUR 1,138 million in 2013, which is EUR 944 million lower
than in 2012. The decrease is mainly a result of the
payment of the European Commission fine, increased
working capital usage and the payout of restructuring
charges in 2013.
Cash flows from operating activities
and net capital expenditures
in millions of euros
■-cash flows from operating activities--■-net capital expenditures
2,500
2,000
1,500
1,000
500
0
(500)
(1,000)
(1,500)
985
(574)
2009
1,931
(696)
2010
760
(857)
2011
2,082
(455)
2012
1,138
(966)
2013