Philips 2013 Annual Report Download - page 178
Download and view the complete annual report
Please find page 178 of the 2013 Philips annual report below. You can navigate through the pages in the report by either clicking on the pages listed below, or by using the keyword search tool below to find specific information within the annual report.-
 1
1 -
2
-
3
-
4
-
5
-
6
-
7
-
8
-
9
-
10
-
11
-
12
-
13
-
14
-
15
-
16
-
17
-
18
-
19
-
20
-
21
-
22
-
23
-
24
-
25
-
26
-
27
-
28
-
29
-
30
-
31
-
32
-
33
-
34
-
35
-
36
-
37
-
38
-
39
-
40
-
41
-
42
-
43
-
44
-
45
-
46
-
47
-
48
-
49
-
50
-
51
-
52
-
53
-
54
-
55
-
56
-
57
-
58
-
59
-
60
-
61
-
62
-
63
-
64
-
65
-
66
-
67
-
68
-
69
-
70
-
71
-
72
-
73
-
74
-
75
-
76
-
77
-
78
-
79
-
80
-
81
-
82
-
83
-
84
-
85
-
86
-
87
-
88
-
89
-
90
-
91
-
92
-
93
-
94
-
95
-
96
-
97
-
98
-
99
-
100
-
101
-
102
-
103
-
104
-
105
-
106
-
107
-
108
-
109
-
110
-
111
-
112
-
113
-
114
-
115
-
116
-
117
-
118
-
119
-
120
-
121
-
122
-
123
-
124
-
125
-
126
-
127
-
128
-
129
-
130
-
131
-
132
-
133
-
134
-
135
-
136
-
137
-
138
-
139
-
140
-
141
-
142
-
143
-
144
-
145
-
146
-
147
-
148
-
149
-
150
-
151
-
152
-
153
-
154
-
155
-
156
-
157
-
158
-
159
-
160
-
161
-
162
-
163
-
164
-
165
-
166
-
167
-
 168
168 -
 169
169 -
 170
170 -
 171
171 -
 172
172 -
 173
173 -
 174
174 -
 175
175 -
 176
176 -
 177
177 -
 178
178 -
 179
179 -
 180
180 -
 181
181 -
 182
182 -
 183
183 -
 184
184 -
 185
185 -
 186
186 -
 187
187 -
 188
188 -
189
-
190
-
191
-
192
-
193
-
194
-
195
-
196
-
197
-
198
-
199
-
200
-
201
-
202
-
203
-
204
-
205
-
206
-
207
-
208
-
209
-
210
-
211
-
212
-
213
-
214
-
215
-
216
-
217
-
218
-
219
-
220
-
221
-
222
-
223
-
224
-
225
-
226
-
227
-
228
-
229
-
230
-
231
-
232
-
233
-
234
-
235
-
236
-
237
-
238
-
239
-
240
-
241
-
242
-
243
-
244
-
245
-
246
-
247
-
248
-
249
-
250
 |
 |

32 33 11 Group financial statements 11.9 - 11.9
178 Annual Report 2013
2013, 509,195 shares were issued in conjunction with conversions at an
average price of EUR 14.21 (2012: 270,827 shares at an average price of EUR
14.22; 2011: 1,079 shares at an average price of EUR 24.66).
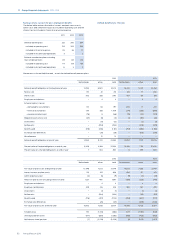
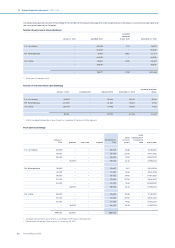
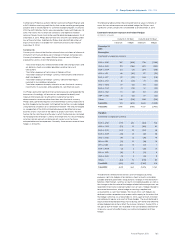
32 Related-party transactions
In the normal course of business, Philips purchases and sells goods and
services from/to various related parties in which Philips typically holds a
50% or less equity interest and has significant influence. These
transactions are generally conducted with terms comparable to
transactions with third parties.
2011 2012 2013
Sales of goods and services 278 288 305
Purchases of goods and services 117 130 143
Receivables from related parties 19 13 39
Payables to related parties 6 4 4
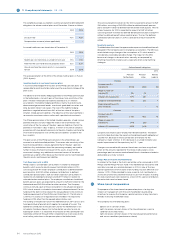
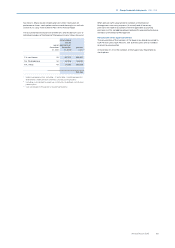
Based on its 30% share in the TP Vision venture, Philips had various
commitments to provide further funding to the TP Vision venture at
December 31, 2013:
• A subordinated shareholder loan of EUR 51 million (fully drawn) can be
extended depending on the venture’s funding needs. EUR 21 million of
this loan is due in April 2015 and EUR 30 million due in April 2017,
• A senior 12-month EUR 30 million bridge loan facility (undrawn) to the
venture can be extended up to April 2017 depending on the venture’s
funding needs,
• A committed EUR 60 million loan facility (undrawn) that can be
extended up to April 2018, depending on the venture’s funding needs.
On 20 January 2014, Philips has signed a term sheet to transfer its
remaining 30% stake in the TP Vision venture, which will also impact the
above commitments (note 36, Subsequent events).
See also, note 7, Discontinued operations and other assets classified as
held for sale for further details on the Television business divestment.
In light of the composition of the Executive Committee during 2012 and
2013, the Company considered the members of the Executive Committee
and the Supervisory board to be the key management personnel as
defined in IAS 24 ‘Related parties’. In 2011, the Company considered the
members of the Board of Management and the Supervisory Board to be
the key management personnel.
For remuneration details of the Executive Committee, the Board of
Management and the Supervisory Board see note 33, Information on
remuneration.
For employee benefit plans see note 30, Post-employment benefits.
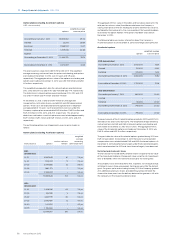
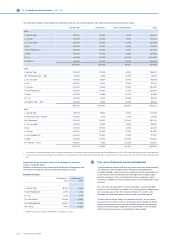
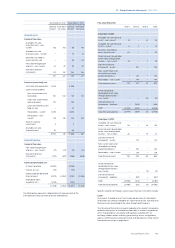
33 Information on remuneration
Remuneration of the Executive Committee
In 2013, the total remuneration costs relating to the members of the
Executive Committee (including the members of the Board of
Management) amounted to EUR 24,773,537 (2012: EUR 18,585,112)
consisting of the elements in the table below.
Remuneration costs of the Executive Committee
in euros
2012 2013
Salary 5,640,090 6,011,557
Annual incentive1) 4,839,949 4,422,732
Performance shares2) 1,049,205 6,478,554
Stock options2) 1,194,444 2,020,040
Restricted share rights2) 1,566,448 1,115,504
Pension costs 2,054,516 2,277,705
Other compensation3) 2,240,460 2,447,445
1) The annual incentives are related to the performance in the year reported
which are paid out in the subsequent year
2) Costs of performance shares, stock options and restricted share rights are
based on accounting standards (IFRS) and do not reflect the value of stock
options at the end of the lock up period and the value of performance
shares and restricted share rights at the vesting/release date. Costs for the
Accelerate! Grant are included
3) The stated amount concern (share of) allowances to members of the
Executive Committee that can be considered as remuneration. In a
situation where such a share of an allowance can be considered as
(indirect) remuneration (for example, private use of the company car),
then the share is both valued and accounted for here. The method
employed by the fiscal authorities in the Netherlands is the starting point
for the value stated. The crisis tax levy of 16% as imposed by the Dutch
government amounts to EUR 1,245,944 (2012: EUR 702,940). This crisis tax
is payable by the employer and is charged over income of employees
exceeding a EUR 150,000 threshold in 2012 and 2013. These amounts are
included in the amounts stated under Other compensation
At December 31, 2013, the members of the Executive Committee (including
the members of the Board of Management) held 1,479,498 (2012:
1,376,913) stock options at a weighted average exercise price of EUR 18.69
(2012: EUR 18.23).
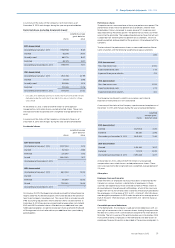
Remuneration of the Board of Management
In 2013, the total remuneration costs relating to the members of the Board
of Management amounted to EUR 10,928,951 (2012: EUR 7,301,334; 2011:
EUR 10,844,833).
At December 31, 2013, the members of the Board of Management held
586,500 stock options (2012: 454,500; 2011: 1,072,431) at a weighted
average exercise price of EUR 19.60. (2012: EUR 18.78; 2011: EUR 23.01).