Philips 2013 Annual Report Download - page 47
Download and view the complete annual report
Please find page 47 of the 2013 Philips annual report below. You can navigate through the pages in the report by either clicking on the pages listed below, or by using the keyword search tool below to find specific information within the annual report.-
 1
1 -
2
-
3
-
4
-
5
-
6
-
7
-
8
-
9
-
10
-
11
-
12
-
13
-
14
-
15
-
16
-
17
-
18
-
19
-
20
-
21
-
22
-
23
-
24
-
25
-
26
-
27
-
28
-
29
-
30
-
31
-
32
-
33
-
34
-
35
-
36
-
 37
37 -
 38
38 -
 39
39 -
 40
40 -
 41
41 -
 42
42 -
 43
43 -
 44
44 -
 45
45 -
 46
46 -
 47
47 -
 48
48 -
 49
49 -
 50
50 -
 51
51 -
 52
52 -
 53
53 -
 54
54 -
 55
55 -
 56
56 -
 57
57 -
58
-
59
-
60
-
61
-
62
-
63
-
64
-
65
-
66
-
67
-
68
-
69
-
70
-
71
-
72
-
73
-
74
-
75
-
76
-
77
-
78
-
79
-
80
-
81
-
82
-
83
-
84
-
85
-
86
-
87
-
88
-
89
-
90
-
91
-
92
-
93
-
94
-
95
-
96
-
97
-
98
-
99
-
100
-
101
-
102
-
103
-
104
-
105
-
106
-
107
-
108
-
109
-
110
-
111
-
112
-
113
-
114
-
115
-
116
-
117
-
118
-
119
-
120
-
121
-
122
-
123
-
124
-
125
-
126
-
127
-
128
-
129
-
130
-
131
-
132
-
133
-
134
-
135
-
136
-
137
-
138
-
139
-
140
-
141
-
142
-
143
-
144
-
145
-
146
-
147
-
148
-
149
-
150
-
151
-
152
-
153
-
154
-
155
-
156
-
157
-
158
-
159
-
160
-
161
-
162
-
163
-
164
-
165
-
166
-
167
-
168
-
169
-
170
-
171
-
172
-
173
-
174
-
175
-
176
-
177
-
178
-
179
-
180
-
181
-
182
-
183
-
184
-
185
-
186
-
187
-
188
-
189
-
190
-
191
-
192
-
193
-
194
-
195
-
196
-
197
-
198
-
199
-
200
-
201
-
202
-
203
-
204
-
205
-
206
-
207
-
208
-
209
-
210
-
211
-
212
-
213
-
214
-
215
-
216
-
217
-
218
-
219
-
220
-
221
-
222
-
223
-
224
-
225
-
226
-
227
-
228
-
229
-
230
-
231
-
232
-
233
-
234
-
235
-
236
-
237
-
238
-
239
-
240
-
241
-
242
-
243
-
244
-
245
-
246
-
247
-
248
-
249
-
250
 |
 |

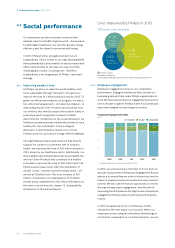
4 Group performance 4.1.15 - 4.1.15
Annual Report 2013 47
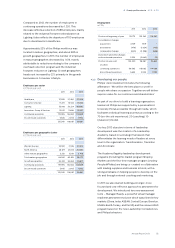
Condensed consolidated statements of cash flows for
the years ended December 31, 2011, 2012 and 2013 are
presented below:
Condensed consolidated cash flow statements1)
in millions of euros
2011 2012 2013
Cash flows from operating activities:
Net income (loss) (1,456) (30) 1,172
Adjustments to reconcile net income to
net cash provided by operating
activities 2,216 2,112 (34)
Net cash provided by operating
activities 760 2,082 1,138
Net cash (used for) provided by
investing activities (1,275) (925) (997)
Cash flows before financing activities2) (515) 1,157 141
Net cash used for financing activities (1,790) (293) (1,241)
Cash (used for) provided by continuing
operations (2,305) 864 (1,100)
Net cash (used for) discontinued
operations (374) (126) (206)
Eect of changes in exchange rates on
cash and cash equivalents (7) (51) (63)
Total change in cash and cash
equivalents (2,686) 687 (1,369)
Cash and cash equivalents at the
beginning of year 5,833 3,147 3,834
Cash and cash equivalents at the end
of year 3,147 3,834 2,465
1) Please refer to section 11.7, Consolidated statements of cash flows, of this
Annual Report
2) Please refer to chapter 14, Reconciliation of non-GAAP information, of this
Annual Report
Cash flows from investing activities
In 2013, cash flows from investing activities resulted in a
net outflow of EUR 997 million. This was attributable to
EUR 966 million cash used for net capital expenditures,
EUR 101 million cash used for derivatives and current
financial assets, as well as EUR 24 million used for
acquisitions of businesses and non-current financial
assets, partly oset by EUR 94 million of net proceeds
from divestments.
In 2012, cash flows from investing activities resulted in a
net outflow of EUR 925 million. This was attributable to
EUR 455 million cash used for net capital expenditures,
EUR 261 million used for acquisitions, as well as a EUR
167 million outflow for financial assets, mainly due to
loans provided to TPV and the TP Vision venture in
connection with the divestment of the Television
business (EUR 151 million in aggregate).
Net capital expenditures
Net capital expenditures totaled EUR 966 million,
which was EUR 511 million higher than in 2012, mainly
reflecting the impact of proceeds received in 2012 from
the sale of the High Tech Campus of EUR 425 million
and the 2012 divestment of Philips’ 50% ownership right
in the Senseo trademark to Sara Lee for EUR 170 million.
Excluding these impacts in 2012, net capital
expenditures were EUR 84 million lower than in 2012,
mainly due to lower investments at Lighting.
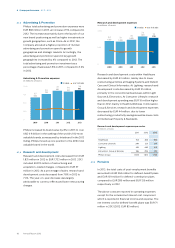
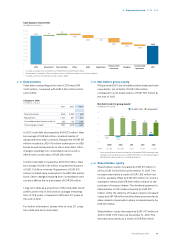
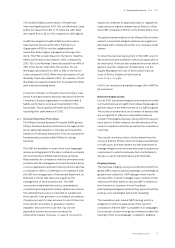
Cash flows from acquisitions and financial assets,
divestments and derivatives
in millions of euros
■-divestments and derivatives--■-acquisitions and financial assets
1,000
500
0
(500)
(1,000)
763
(301)
462
2009
360
(241)
119
2010
132
(550)
(418)
2011
(42)
(428)
(470)
2012
(7)
(24)
(31)
2013
Acquisitions and financial assets
The net cash impact of acquisitions of businesses and
financial assets in 2013 was a total of EUR 24 million.
There was a EUR 11 million outflow for acquisitions of
businesses and a EUR 13 million outflow for financial
assets.
The net cash impact of acquisitions of businesses and
financial assets in 2012 was a total of EUR 428 million,
mainly related to the acquisition of Indal. The EUR 167
million outflow for financial assets mainly related to
loans provided to TPV and the TP Vision venture in
connection with the divestment of the Television
business (EUR 151 million in aggregate).
Divestments and derivatives
Cash proceeds of EUR 94 million were received from
divestments, mainly of non-strategic businesses within
Healthcare. Cash flows from derivatives and current
financial assets led to a net cash outflow of EUR 101
million.
In 2012, cash proceeds of EUR 4 million were received
from divestments. Cash flows from derivatives and
securities led to a net cash outflow of EUR 46 million.