Philips 2013 Annual Report Download - page 152
Download and view the complete annual report
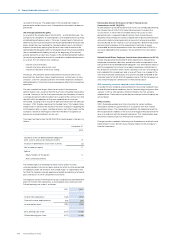
Please find page 152 of the 2013 Philips annual report below. You can navigate through the pages in the report by either clicking on the pages listed below, or by using the keyword search tool below to find specific information within the annual report.-
 1
1 -
2
-
3
-
4
-
5
-
6
-
7
-
8
-
9
-
10
-
11
-
12
-
13
-
14
-
15
-
16
-
17
-
18
-
19
-
20
-
21
-
22
-
23
-
24
-
25
-
26
-
27
-
28
-
29
-
30
-
31
-
32
-
33
-
34
-
35
-
36
-
37
-
38
-
39
-
40
-
41
-
42
-
43
-
44
-
45
-
46
-
47
-
48
-
49
-
50
-
51
-
52
-
53
-
54
-
55
-
56
-
57
-
58
-
59
-
60
-
61
-
62
-
63
-
64
-
65
-
66
-
67
-
68
-
69
-
70
-
71
-
72
-
73
-
74
-
75
-
76
-
77
-
78
-
79
-
80
-
81
-
82
-
83
-
84
-
85
-
86
-
87
-
88
-
89
-
90
-
91
-
92
-
93
-
94
-
95
-
96
-
97
-
98
-
99
-
100
-
101
-
102
-
103
-
104
-
105
-
106
-
107
-
108
-
109
-
110
-
111
-
112
-
113
-
114
-
115
-
116
-
117
-
118
-
119
-
120
-
121
-
122
-
123
-
124
-
125
-
126
-
127
-
128
-
129
-
130
-
131
-
132
-
133
-
134
-
135
-
136
-
137
-
138
-
139
-
140
-
141
-
 142
142 -
 143
143 -
 144
144 -
 145
145 -
 146
146 -
 147
147 -
 148
148 -
 149
149 -
 150
150 -
 151
151 -
 152
152 -
 153
153 -
 154
154 -
 155
155 -
 156
156 -
 157
157 -
 158
158 -
 159
159 -
 160
160 -
 161
161 -
 162
162 -
163
-
164
-
165
-
166
-
167
-
168
-
169
-
170
-
171
-
172
-
173
-
174
-
175
-
176
-
177
-
178
-
179
-
180
-
181
-
182
-
183
-
184
-
185
-
186
-
187
-
188
-
189
-
190
-
191
-
192
-
193
-
194
-
195
-
196
-
197
-
198
-
199
-
200
-
201
-
202
-
203
-
204
-
205
-
206
-
207
-
208
-
209
-
210
-
211
-
212
-
213
-
214
-
215
-
216
-
217
-
218
-
219
-
220
-
221
-
222
-
223
-
224
-
225
-
226
-
227
-
228
-
229
-
230
-
231
-
232
-
233
-
234
-
235
-
236
-
237
-
238
-
239
-
240
-
241
-
242
-
243
-
244
-
245
-
246
-
247
-
248
-
249
-
250
 |
 |

11 Group financial statements 11.9 - 11.9
152 Annual Report 2013
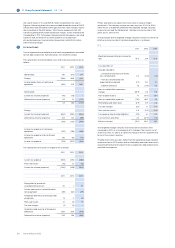
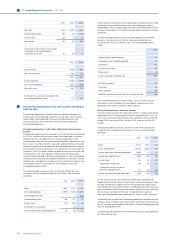
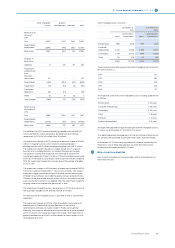
Deferred tax assets and liabilities relate to the balance sheet captions, as
follows:
assets liabilities net
2013
Intangible assets 116 (987) (871)
Property, plant and equipment 107 (49) 58
Inventories 271 (7) 264
Prepaid pension costs 1 (2) (1)
Other receivables 60 (10) 50
Other assets 48 (16) 32
Provisions:
- pensions 426 − 426
- guarantees 29 − 29
- termination benefits 97 − 97
- other postretirement 57 − 57
- other 581 (14) 567
Other liabilities 213 (21) 192
Tax loss carryforwards (including tax
credit carryforwards) 699 − 699
2,705 (1,106) 1,599
Set-o of deferred tax positions (1,030) 1,030 −
Net deferred tax assets 1,675 (76) 1,599
assets liabilities net
2012
Intangible assets 151 (1,079) (928)
Property, plant and equipment 115 (47) 68
Inventories 263 (5) 258
Prepaid pension costs 2 (2) −
Other receivables 58 (3) 55
Other assets 54 (12) 42
Provisions: −
- pensions 599 (1) 598
- guarantees 26 − 26
- termination benefits 117 1 118
- other postretirement 72 − 72
- other 624 (19) 605
Other liabilities 198 (27) 171
Tax loss carryforwards (including tax
credit carryforwards) 742 − 742
3,021 (1,194) 1,827
Set-o of deferred tax positions (1,102) 1,102 −
Net deferred tax assets 1,919 (92) 1,827
Deferred tax assets are recognized for temporary dierences, unused tax
losses, and unused tax credits to the extent that realization of the related
tax benefits is probable. The ultimate realization of deferred tax assets is
dependent upon the generation of future taxable income in the countries
where the deferred tax assets originated and during the periods when the
deferred tax assets become deductible. Management considers the
scheduled reversal of deferred tax liabilities, projected future taxable
income, and tax planning strategies in making this assessment.
The net deferred tax assets of EUR 1,599 million (2012: EUR 1,827 million)
consist of deferred tax assets of EUR 1,675 million (2012: EUR 1,919 million)
in countries with a net deferred tax asset position and deferred tax
liabilities of EUR 76 million (2012: EUR 92 million) in countries with a net
deferred tax liability position. Of the total deferred tax assets of EUR 1,675
million at December 31, 2013, (2012: EUR 1,919 million), EUR 543 million
(2012: EUR 507 million) is recognized in respect of fiscal entities in various
countries where there have been fiscal losses in the current or preceding
period. Management’s projections support the assumption that it is
probable that the results of future operations will generate sufficient
taxable income to utilize these deferred tax assets.
At December 31, 2013 and 2012, there were no recognized deferred tax
liabilities for taxes that would be payable on the unremitted earnings of
certain foreign subsidiaries of Philips Holding USA since it has been
determined that undistributed profits of such subsidiaries will not be
distributed in the foreseeable future. The temporary dierences
associated with the investments in subsidiaries of Philips Holding USA, for
which a deferred tax liability has not been recognized, aggregate to EUR
32 million (2012: EUR 35 million).
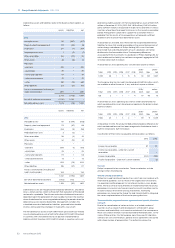
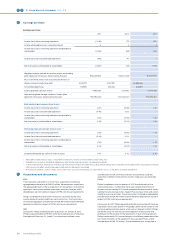
At December 31, 2013, operating loss carryforwards expire as follows:
Total 2014 2015 2016 2017 2018
2019/
2023 later
unlimi-
ted
4,330 28 1 3 6 6 44 841 3,401
The Company also has tax credit carryforwards of EUR 138 million, which
are available to oset future tax, if any, and which expire as follows:
Total 2014 2015 2016 2017 2018
2019/
2023 later
unlimi-
ted
138 3 − 1 − 4 19 95 16
At December 31, 2013 , operating loss and tax credit carryforwards for
which no deferred tax assets have been recognized in the balance sheet,
expire as follows:
Total 2014 2015 2016 2017 2018
2019/
2023 later
unlimi-
ted
1,928 25 1 3 2 − 39 9 1,849
At December 31, 2013, the amount of deductible temporary dierences for
which no deferred tax asset has been recognized in the balance sheet is
EUR 151 million (2012: EUR 157 million).
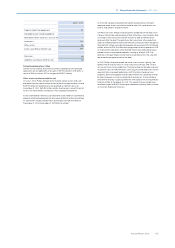
Classification of the income tax payable and receivable is as follows:
2012 2013
Income tax receivable 97 70
Income tax receivable - under non-current
receivables − −
Income tax payable (200) (143)
Income tax payable - under non-current liabilities − (1)
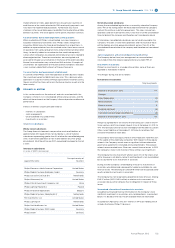
Tax risks
Philips is exposed to tax uncertainties. These uncertainties include
amongst others the following:
Transfer pricing uncertainties
Philips has issued transfer pricing directives, which are in accordance with
international guidelines such as those of the Organization of Economic
Co-operation and Development. As transfer pricing has a cross-border
eect, the focus of local tax authorities on implemented transfer pricing
procedures in a country may have an impact on results in another country.
In order to reduce the transfer pricing uncertainties, monitoring
procedures are carried out by Group Tax and Internal Audit to safeguard
the correct implementation of the transfer pricing directives.
Tax uncertainties on general service agreements and specific allocation
contracts
Due to the centralization of certain activities in a limited number of
countries (such as research and development, centralized IT, group
functions and head office), costs are also centralized. As a consequence,
these costs and/or revenues must be allocated to the beneficiaries, i.e. the
various Philips entities. For that purpose, apart from specific allocation
contracts for costs and revenues, general service agreements are signed
with a large number of group entities. Tax authorities review the