Philips 2013 Annual Report Download - page 209
Download and view the complete annual report
Please find page 209 of the 2013 Philips annual report below. You can navigate through the pages in the report by either clicking on the pages listed below, or by using the keyword search tool below to find specific information within the annual report.-
 1
1 -
2
-
3
-
4
-
5
-
6
-
7
-
8
-
9
-
10
-
11
-
12
-
13
-
14
-
15
-
16
-
17
-
18
-
19
-
20
-
21
-
22
-
23
-
24
-
25
-
26
-
27
-
28
-
29
-
30
-
31
-
32
-
33
-
34
-
35
-
36
-
37
-
38
-
39
-
40
-
41
-
42
-
43
-
44
-
45
-
46
-
47
-
48
-
49
-
50
-
51
-
52
-
53
-
54
-
55
-
56
-
57
-
58
-
59
-
60
-
61
-
62
-
63
-
64
-
65
-
66
-
67
-
68
-
69
-
70
-
71
-
72
-
73
-
74
-
75
-
76
-
77
-
78
-
79
-
80
-
81
-
82
-
83
-
84
-
85
-
86
-
87
-
88
-
89
-
90
-
91
-
92
-
93
-
94
-
95
-
96
-
97
-
98
-
99
-
100
-
101
-
102
-
103
-
104
-
105
-
106
-
107
-
108
-
109
-
110
-
111
-
112
-
113
-
114
-
115
-
116
-
117
-
118
-
119
-
120
-
121
-
122
-
123
-
124
-
125
-
126
-
127
-
128
-
129
-
130
-
131
-
132
-
133
-
134
-
135
-
136
-
137
-
138
-
139
-
140
-
141
-
142
-
143
-
144
-
145
-
146
-
147
-
148
-
149
-
150
-
151
-
152
-
153
-
154
-
155
-
156
-
157
-
158
-
159
-
160
-
161
-
162
-
163
-
164
-
165
-
166
-
167
-
168
-
169
-
170
-
171
-
172
-
173
-
174
-
175
-
176
-
177
-
178
-
179
-
180
-
181
-
182
-
183
-
184
-
185
-
186
-
187
-
188
-
189
-
190
-
191
-
192
-
193
-
194
-
195
-
196
-
197
-
198
-
 199
199 -
 200
200 -
 201
201 -
 202
202 -
 203
203 -
 204
204 -
 205
205 -
 206
206 -
 207
207 -
 208
208 -
 209
209 -
 210
210 -
 211
211 -
 212
212 -
 213
213 -
 214
214 -
 215
215 -
 216
216 -
 217
217 -
 218
218 -
 219
219 -
220
-
221
-
222
-
223
-
224
-
225
-
226
-
227
-
228
-
229
-
230
-
231
-
232
-
233
-
234
-
235
-
236
-
237
-
238
-
239
-
240
-
241
-
242
-
243
-
244
-
245
-
246
-
247
-
248
-
249
-
250
 |
 |

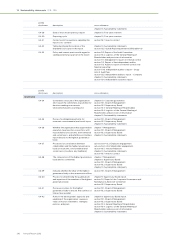
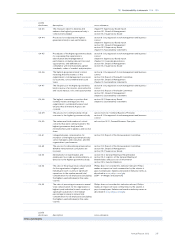
13 Sustainability statements 13.3.1 - 13.3.3
Annual Report 2013 209
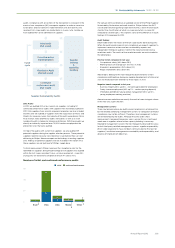
Operational carbon footprint for logistics
in kilotonnes CO2-equivalent
2009 2010 2011 2012 2013
Air transport 308 345 328 309 326
Road transport 174 160 176 105 108
Sea transport 145 167 153 132 141
Philips Group 627 672 657 546 575
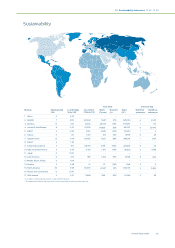
13.3.2 Biodiversity
Philips recognizes the importance of healthy ecosystems and rich
biodiversity for our company, our employees, and society as a whole. We
aim to minimize any negative impacts and actively promote ecosystem
restoration activities including biodiversity restoration projects with social
components, sustainable development, poverty relief, and carbon
osetting.
In 2013 Philips made significant steps forward in biodiversity
management, both on sites, on natural capital valuation and on the
management level. The steps were led by the Philips Leaders for Nature
(LFN) team, site management, local sustainability organizations
worldwide, sustainability managers, and Group Sustainability in
Eindhoven, the Netherlands. We made intensive use of the internal
company-wide social network platform to create and share activities and
achievements including training programs. We continued our global
partnership with the International Union for the Conservation of Nature
(IUCN) Netherlands Committee and our participation in the IUCN LFN
program which brings companies, NGOs and government together to work
on the topic of business and biodiversity.
Our projects in 2013 included improving our understanding of biodiversity
by organizing together with the IUCN a very well-attended Business &
Ecosystems Training (BET) on the topics of Natural Capital, Ecosystem
Services and Biodiversity and the link to business. We worked on actively
preserving biodiversity in and around our industrial sites with local
communities and environmental organizations. In the Netherlands, the
Drachten Consumer Lifestyle and Best Healthcare plants restructured
their sites for optimal restoration of biodiversity and employee well-being.
Other examples are a large-scale employee-led biodiversity initiative in
Reedsville, Pennsylvania; and conservation eorts in the Miribel (France),
Ketrzyn Farel and Pila (Poland), San Jose (USA), Varginha (Brazil), and
Pune (India) sites for example. In addition Philips employees established a
community garden at the High-Tech Campus in Eindhoven (the
Netherlands). A diverse team organized several internal and external
events for the Netherlands sustainability day in October 2013 – including
an introduction to the Circular Economy program and a product
disassembly workshop. Finally, Philips co-hosted the “Mind Your
Business” event with PwC and the Netherlands Ministry of Economic
Aairs on ‘The transition to a bio-based economy – the role of
government, the impact of/for companies, and partnerships/networks –
the necessity of joint projects and knowledge sharing’.
We also conducted a biodiversity survey and water risk investigation of our
industrial sites. The biodiversity survey results have enabled us to build a
knowledge base of endangered and resident species, nature reserves and
wildlife corridors, biodiversity initiatives and partnerships at Philips
industrial sites. This will enable us to prepare biodiversity guidelines for
sites.
Philips commissioned Trucost, in 2013, to perform an Environmental Profit
and Loss (EP&L) analysis using 2012 data to help identify natural capital
dependency “hot spots” and place a financial value on Philips
environmental impacts. The preliminary results show that between 2007
and 2012 Philips was able to decrease its exposure to natural capital risks
and hence be better positioned to succeed in a natural capital constrained
economy. Together with the WBCSD we will further develop the EP&L
concept and methodology, including the environmental benefits.
To build and expand the Philips biodiversity strategy Philips has
developed a biodiversity policy.
13.3.3 Green Operations
In 2010, we decided to group all activities related to improving the
environmental performance of our manufacturing facilities (including
chemicals management) under the Green Manufacturing 2015 program,
which we renamed to Green Operations. The program focuses on most
contributors to climate change, but also addresses water, recycling of
waste and chemical substances.
In the course of 2013 we implemented an improved process to report
chemicals used in processes in more detail. Based on the new insights
gained, we included a few additional substances to our reporting scope in
2013. These substances do not have a material impact on our reported
data. New chemicals on which we will focus our reduction eorts and new
reduction targets will be incorporated in the next Green Operations
program.
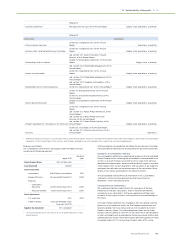
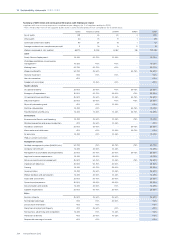
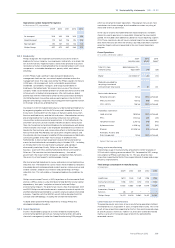
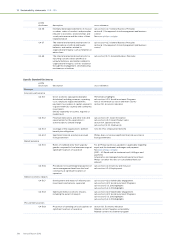
Green Operations
in % unless otherwise stated
2007
baseline year
2013
actual1)
2015
target1)
Total CO2 from
manufacturing
865 kilotonnes CO2 -
equivalent (19) (25)
Water 4.2 million m3 20 (10)
Materials provided for
recycling via external
contractor per total waste 79 81 80
Restricted substances:
Benzene emission 52 kg (100) achieved
Mercury emission 185 kg (96) (100)
CFCs, HCFCs 156 kg (100) achieved
Hazardous substances
Lead emission 1,838 kg (100) achieved
PFCs 1,534 kg 248 (35)
Toluene emission 2,210 kg (46) (90)
Xylene emission 4,506 kg 525 (90)
Styrene 80,526 kg (93) achieved
Antimony, Arsenic and
their compounds 18 kg (100) achieved
1) Against the base year 2007
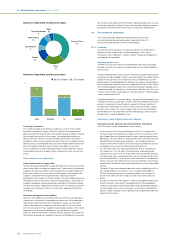
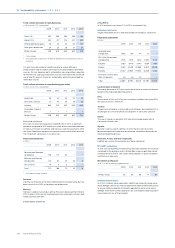
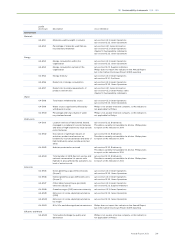
Energy use in manufacturing
Total energy usage in manufacturing amounted to 14,160 terajoules in
2013, of which Lighting consumes about 79%. Compared to 2012, energy
consumption at Philips went down by 2%. This was driven by new
acquisitions reporting for the first time, organizational changes and energy
efficiency improvements.
Total energy consumption in manufacturing
in terajoules
2009 2010 2011 2012 2013
Healthcare 1,670 1,545 1,541 1,798 1,794
Consumer Lifestyle 1,188 1,274 1,252 1,104 1,142
Lighting 11,535 11,580 11,189 11,519 11,224
Innovation, Group &
Services 28 27 − − −
Philips Group 14,421 14,426 13,982 14,421 14,160
Carbon emissions in manufacturing
The greenhouse gas emissions of our manufacturing operations totaled
705 kilotonnes CO2-equivalent in 2013, 2% higher than in 2012. This is the
result of new acquisitions reporting for the first time and increased usage
of specific process chemicals. Indirect CO2 emissions overall decreased,
mainly as a result of increased usage of electricity generated by
renewable sources.