Philips 2013 Annual Report Download - page 210
Download and view the complete annual report
Please find page 210 of the 2013 Philips annual report below. You can navigate through the pages in the report by either clicking on the pages listed below, or by using the keyword search tool below to find specific information within the annual report.-
 1
1 -
2
-
3
-
4
-
5
-
6
-
7
-
8
-
9
-
10
-
11
-
12
-
13
-
14
-
15
-
16
-
17
-
18
-
19
-
20
-
21
-
22
-
23
-
24
-
25
-
26
-
27
-
28
-
29
-
30
-
31
-
32
-
33
-
34
-
35
-
36
-
37
-
38
-
39
-
40
-
41
-
42
-
43
-
44
-
45
-
46
-
47
-
48
-
49
-
50
-
51
-
52
-
53
-
54
-
55
-
56
-
57
-
58
-
59
-
60
-
61
-
62
-
63
-
64
-
65
-
66
-
67
-
68
-
69
-
70
-
71
-
72
-
73
-
74
-
75
-
76
-
77
-
78
-
79
-
80
-
81
-
82
-
83
-
84
-
85
-
86
-
87
-
88
-
89
-
90
-
91
-
92
-
93
-
94
-
95
-
96
-
97
-
98
-
99
-
100
-
101
-
102
-
103
-
104
-
105
-
106
-
107
-
108
-
109
-
110
-
111
-
112
-
113
-
114
-
115
-
116
-
117
-
118
-
119
-
120
-
121
-
122
-
123
-
124
-
125
-
126
-
127
-
128
-
129
-
130
-
131
-
132
-
133
-
134
-
135
-
136
-
137
-
138
-
139
-
140
-
141
-
142
-
143
-
144
-
145
-
146
-
147
-
148
-
149
-
150
-
151
-
152
-
153
-
154
-
155
-
156
-
157
-
158
-
159
-
160
-
161
-
162
-
163
-
164
-
165
-
166
-
167
-
168
-
169
-
170
-
171
-
172
-
173
-
174
-
175
-
176
-
177
-
178
-
179
-
180
-
181
-
182
-
183
-
184
-
185
-
186
-
187
-
188
-
189
-
190
-
191
-
192
-
193
-
194
-
195
-
196
-
197
-
198
-
199
-
 200
200 -
 201
201 -
 202
202 -
 203
203 -
 204
204 -
 205
205 -
 206
206 -
 207
207 -
 208
208 -
 209
209 -
 210
210 -
 211
211 -
 212
212 -
 213
213 -
 214
214 -
 215
215 -
 216
216 -
 217
217 -
 218
218 -
 219
219 -
 220
220 -
221
-
222
-
223
-
224
-
225
-
226
-
227
-
228
-
229
-
230
-
231
-
232
-
233
-
234
-
235
-
236
-
237
-
238
-
239
-
240
-
241
-
242
-
243
-
244
-
245
-
246
-
247
-
248
-
249
-
250
 |
 |
13 Sustainability statements 13.3.3 - 13.3.3
210 Annual Report 2013
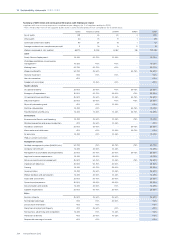
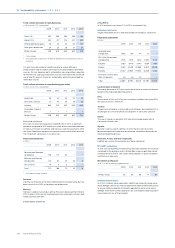
Total carbon emissions in manufacturing
in kilotonnes CO2-equivalent
2009 2010 2011 2012 2013
Direct CO2 1) 295 299 294 294 281
Indirect CO2443 317 273 310 293
Other greenhouse gases 54 34 40 60 104
From glass production 24 25 28 27 27
Philips Group2) 816 675 635 691 705
1) From energy
2) Excluding new acquisitions therefore dierent from Operational carbon
footprint
CO2 emissions decreased at Healthcare due to energy efficiency
improvements and increased use of electricity generated by renewable
sources, this was however partly mitigated by new acquisitions reporting
for the first time. Lighting increased its CO2 emissions due to the increased
use of specific process chemicals, mitigated by electricity generated by
renewable sources.
Total carbon emissions in manufacturing per sector
in kilotonnes CO2-equivalent
2009 2010 2011 2012 2013
Healthcare 118 57 54 70 58
Consumer Lifestyle 53 42 39 38 38
Lighting 644 575 542 583 609
Innovation, Group &
Services 1 1 − − −
Philips Group 816 675 635 691 705
Restricted substances
Emissions of restricted substances totaled 9 kilos in 2013, a significant
decrease compared to 2012 mainly as a result of the continued reduction
in mercury emissions in Lighting, and more accurate measurements. With
the Green Operations program we continue to focus on a selection of the
most important substances in our processes.
Restricted substances
in kilos
2009 2010 2011 2012 2013
Benzene and Benzene
compounds 136 101 55 − −
Mercury and Mercury
Compounds 122 83 51 54 8
CFCs/HCFCs1) 14 4 5 1 1
Total 272 188 111 55 9
1) Excluding cooling systems
Benzene
Lighting was the only sector that used benzene in manufacturing, but has
been successful in 2012 in the phase-out of benzene.
Mercury
Mercury is used exclusively by Lighting. Emissions decreased from 54 kg in
2012 to 8 kg in 2013, due to continued emissions reductions activities and
improved measurements.
CFCs/HCFCs
In 2013 total emissions from CFCs/HCFCs remained at 1 kg.
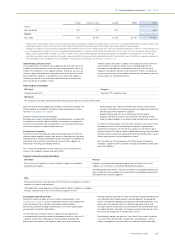
Hazardous substances
Targets have been set on a selected number of hazardous substances.
Hazardous substances
in kilos
2009 2010 2011 2012 2013
Lead and lead
compounds 1,958 108 44 73 1
PFCs (Per Fluorinated
Compounds) 2,535 1,507 1,842 2,560 5,331
Toluene 2,160 6,745 5,745 6,184 1,190
Xylene 4,619 30,491 37,889 18,947 28,176
Styrene 21,567 22,920 19,920 42,329 5,753
Antimony, Arsenic and
their compounds 30 24 37 − −
Total 32,869 61,795 65,477 70,093 40,451
Lead and lead compounds
The strong decrease in 2013 was mainly due to more accurate calculations
based on the improved reporting process.
PFCs
The increase in 2013 to 5,331 kg was caused by Lumileds sites where PFCs
are used as process chemicals.
Toluene
The emission of toluene, mainly used in wet lacquers, decreased by 81% in
2013 largely as a result of phase-out programs in Consumer Lifestyle.
Xylene
The use of xylene increased by 49% due to increased production at
Consumer Lifestyle sites.
Styrene
Styrene is mainly used in Lighting. In 2013, the emission of styrene
decreased significantly due to more accurate calculations based on the
improved reporting process.
Antimony, Arsenic and their compounds
Lighting was successful in phasing-out these substances.
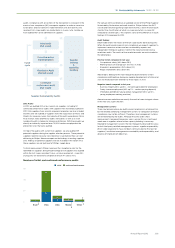
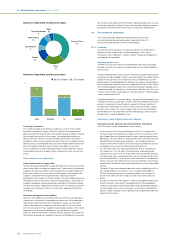
ISO 14001 certification
In 2013, 80% of reporting manufacturing sites were certified. This increase
compared to the previous year is attributable to new acquisitions being
certified for the first time. The sectors have programs in place to address
certification at new sites.
ISO 14001 certification
as a % of all reporting organizations
2009 2010 2011 2012 2013
Philips Group 92 95 89 71 80
Environmental Incidents
In 2013, 3 incidents were reported by Healthcare related to waste water
and a leakage. Consumer Lifestyle reported 1 incident related to emissions
to air and Lighting reported 3 incidents reported to waste water and a
leakage. There were no fines reported in our sustainability reporting tool in
connection with any of the incidents.
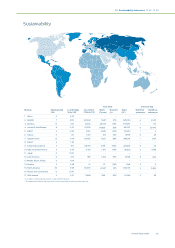
Sustainability world map