Philips 2013 Annual Report Download - page 201
Download and view the complete annual report
Please find page 201 of the 2013 Philips annual report below. You can navigate through the pages in the report by either clicking on the pages listed below, or by using the keyword search tool below to find specific information within the annual report.-
 1
1 -
2
-
3
-
4
-
5
-
6
-
7
-
8
-
9
-
10
-
11
-
12
-
13
-
14
-
15
-
16
-
17
-
18
-
19
-
20
-
21
-
22
-
23
-
24
-
25
-
26
-
27
-
28
-
29
-
30
-
31
-
32
-
33
-
34
-
35
-
36
-
37
-
38
-
39
-
40
-
41
-
42
-
43
-
44
-
45
-
46
-
47
-
48
-
49
-
50
-
51
-
52
-
53
-
54
-
55
-
56
-
57
-
58
-
59
-
60
-
61
-
62
-
63
-
64
-
65
-
66
-
67
-
68
-
69
-
70
-
71
-
72
-
73
-
74
-
75
-
76
-
77
-
78
-
79
-
80
-
81
-
82
-
83
-
84
-
85
-
86
-
87
-
88
-
89
-
90
-
91
-
92
-
93
-
94
-
95
-
96
-
97
-
98
-
99
-
100
-
101
-
102
-
103
-
104
-
105
-
106
-
107
-
108
-
109
-
110
-
111
-
112
-
113
-
114
-
115
-
116
-
117
-
118
-
119
-
120
-
121
-
122
-
123
-
124
-
125
-
126
-
127
-
128
-
129
-
130
-
131
-
132
-
133
-
134
-
135
-
136
-
137
-
138
-
139
-
140
-
141
-
142
-
143
-
144
-
145
-
146
-
147
-
148
-
149
-
150
-
151
-
152
-
153
-
154
-
155
-
156
-
157
-
158
-
159
-
160
-
161
-
162
-
163
-
164
-
165
-
166
-
167
-
168
-
169
-
170
-
171
-
172
-
173
-
174
-
175
-
176
-
177
-
178
-
179
-
180
-
181
-
182
-
183
-
184
-
185
-
186
-
187
-
188
-
189
-
190
-
 191
191 -
 192
192 -
 193
193 -
 194
194 -
 195
195 -
 196
196 -
 197
197 -
 198
198 -
 199
199 -
 200
200 -
 201
201 -
 202
202 -
 203
203 -
 204
204 -
 205
205 -
 206
206 -
 207
207 -
 208
208 -
 209
209 -
 210
210 -
 211
211 -
212
-
213
-
214
-
215
-
216
-
217
-
218
-
219
-
220
-
221
-
222
-
223
-
224
-
225
-
226
-
227
-
228
-
229
-
230
-
231
-
232
-
233
-
234
-
235
-
236
-
237
-
238
-
239
-
240
-
241
-
242
-
243
-
244
-
245
-
246
-
247
-
248
-
249
-
250
 |
 |

13 Sustainability statements 13 - 13.2.1
Annual Report 2013 201
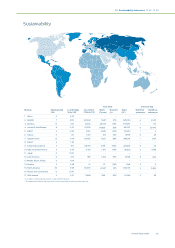
• Based on the Maplecroft Human Rights Risk Indexes, risk countries for
Supply Management in 2013 were: Brazil, China, India, Indonesia,
Mexico, Ukraine, and Vietnam.
• Suppliers of new ventures are included to the extent that the
integration process of these ventures has been finalized. Normative
integration period is two years after closure of the new venture.
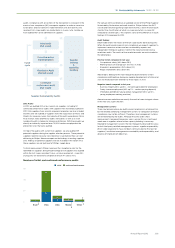
Sustainability governance
Sustainability is strongly embedded in our core business processes, like
innovation (EcoDesign), sourcing (Supplier Sustainability Involvement
Program), manufacturing (Green Manufacturing 2015) and Logistics
(Green Logistics) and projects like the Circular Economy initiative.
The Sustainability Board is the highest governing sustainability body in
Philips, chaired by Jim Andrew, member of the Executive Committee.
Three other Executive Committee members sit in the Sustainability Board
jointly with sector and functional executives. The Sustainability Board
convenes four times per year, defines Philips’ sustainability strategy and
programs, monitors progress and takes corrective action where needed.
Progress on Sustainability is communicated internally on a quarterly basis
to Philips sta and at least annually in the Executive Committee and
Supervisory Board.
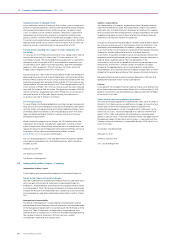
External assurance
KPMG has provided reasonable assurance on whether the information in
chapter 13, Sustainability statements, of this Annual Report and section
4.2, Social performance, of this Annual Report and section 4.3,
Environmental performance, of this Annual Report presents fairly, in all
material respects, the sustainability performance in accordance with the
reporting criteria. We refer to section 13.4, Independent assurance report,
of this Annual Report.
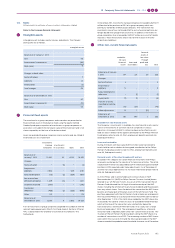
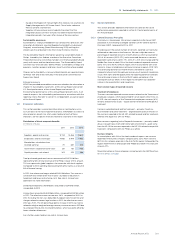
13.1 Economic indicators
This section provides summarized information on contributions on an
accruals basis to the most important economic stakeholders as a basis to
drive economic growth. For a full understanding of each of these
indicators, see the specific financial statements and notes in this report.
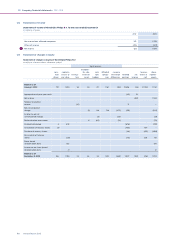
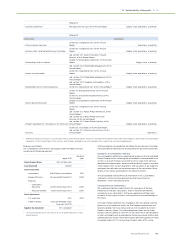
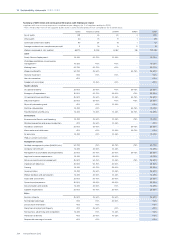
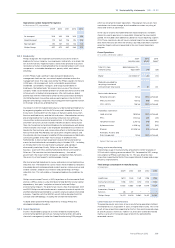
Distribution of direct economic benefits
in millions of euros
2011 2012 2013
Suppliers: goods and services 12,732 14,466 13,641
Employees: salaries and wages 4,668 5,499 4,983
Shareholders: distribution from
retained earnings 711 687 678
Government: corporate income taxes 251 185 466
Capital providers: net interest 302 325 268
Total purchased goods and services amounted to EUR 13.6 billion,
representing 58% of total revenues of the Philips Group. Of this amount,
70% was spent with global suppliers, the remainder with local suppliers.
Compared to 2012, spending decreased significantly mainly as a result of
Bill of Material savings.
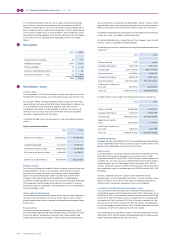
In 2013, the salaries and wages totaled EUR 4.98 billion. This amount is
some EUR 500 million lower than in 2012, caused by a reduction in
headcount and lower restructuring costs. See note 3, Income from
operations for more information.
Dividend distributed to shareholders amounted to EUR 678 million,
comparable to 2012.
Income taxes amounted to EUR 466 million, compared to EUR 185 million
in 2012. The eective income tax rate was 28.1%, compared to 58.0% in
2012. Excluding the non-tax-deductible European Commission fine and
charges related to various legal matters in 2012, the eective tax rate in
2012 was 25.5%. The 2.6 percentage points increase in 2013 was mainly
related to a higher weighted average statutory income tax rate in 2013 due
to a change in the country mix of profit and loss, which was partly oset by
lower valuation allowances.
For a further understanding, see note 5, Income taxes.
13.2 Social statements
This section provides additional information on (some of) the social
performance parameters reported in section 4.2, Social performance, of
this Annual Report
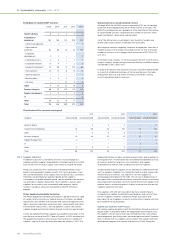
13.2.1 General Business Principles
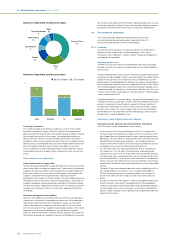
The analysis is based upon 335 concerns reported via the formal GBP
procedure in 2013 relating to alleged violations of the General Business
Principles (GBP), compared to 374 in 2012.
The decrease in the overall number of concerns reported can mainly be
attributed to a decrease in the Americas. We see a slight decrease in
percentage of reported concerns in North America, which accounted for
43% of all concerns (2012: 47%), and a continued decrease in concerns
reported in Latin America (2013: 17%; 2012: 21%, 2011: 32%). Europe and the
Middle East show a stable 15% of the total number of reported concerns
(2012: 15%). Only the Asia Pacific region, which accounted for 25% of all
concerns, shows a notable and continuing increase in reports (2012: 18%).
The continuing dominance in North America we believe is due to a
corporate culture in which employees are very much aware of compliance
issues, their rights and the opportunities for reporting potential violations.
The continuing increase in the Asia Pacific region we believe is the
consequence of our eorts in that region to strengthen our corporate
culture in the area of ethics and compliance.
Most common types of reported concerns
Treatment of employees
The most common reported concern remains related to the Treatment of
employees category, which represented 61% of all reports (2012: 55%). As
in 2012, the vast majority of the Treatment of employees concerns (81%)
remains related to two issues – Equal and fair treatment and Respectful
treatment.
Concerns regarding Equal and fair treatment – primarily favoritism,
discrimination and unfair treatment - originated principally in the US. Of
the concerns reported in the US, 39% related to equal and fair treatment,
whereas that figure was 24% for Philips.
Most concerns regarding lack of Respectful treatment – primarily verbal
abuse, (sexual) harassment and hostile work environment– again come
from the US. Of the concerns reported in the US, 33% related to respectful
treatment; compared to 25% for Philips as a whole.
Business integrity
In second place, with 33% of the total number of reports, are concerns
reported in the Business integrity category (2012: 32%). Most concerns
(60%) in this category originate in the Asia Pacific region. Followed by the
regions North America and Europe and Middle East (both 17%) and Latin
America (7%).
More information on these categories can be found in the GBP Directives
on www.philips.com/gbp.