Philips 2013 Annual Report Download - page 203
Download and view the complete annual report
Please find page 203 of the 2013 Philips annual report below. You can navigate through the pages in the report by either clicking on the pages listed below, or by using the keyword search tool below to find specific information within the annual report.-
 1
1 -
2
-
3
-
4
-
5
-
6
-
7
-
8
-
9
-
10
-
11
-
12
-
13
-
14
-
15
-
16
-
17
-
18
-
19
-
20
-
21
-
22
-
23
-
24
-
25
-
26
-
27
-
28
-
29
-
30
-
31
-
32
-
33
-
34
-
35
-
36
-
37
-
38
-
39
-
40
-
41
-
42
-
43
-
44
-
45
-
46
-
47
-
48
-
49
-
50
-
51
-
52
-
53
-
54
-
55
-
56
-
57
-
58
-
59
-
60
-
61
-
62
-
63
-
64
-
65
-
66
-
67
-
68
-
69
-
70
-
71
-
72
-
73
-
74
-
75
-
76
-
77
-
78
-
79
-
80
-
81
-
82
-
83
-
84
-
85
-
86
-
87
-
88
-
89
-
90
-
91
-
92
-
93
-
94
-
95
-
96
-
97
-
98
-
99
-
100
-
101
-
102
-
103
-
104
-
105
-
106
-
107
-
108
-
109
-
110
-
111
-
112
-
113
-
114
-
115
-
116
-
117
-
118
-
119
-
120
-
121
-
122
-
123
-
124
-
125
-
126
-
127
-
128
-
129
-
130
-
131
-
132
-
133
-
134
-
135
-
136
-
137
-
138
-
139
-
140
-
141
-
142
-
143
-
144
-
145
-
146
-
147
-
148
-
149
-
150
-
151
-
152
-
153
-
154
-
155
-
156
-
157
-
158
-
159
-
160
-
161
-
162
-
163
-
164
-
165
-
166
-
167
-
168
-
169
-
170
-
171
-
172
-
173
-
174
-
175
-
176
-
177
-
178
-
179
-
180
-
181
-
182
-
183
-
184
-
185
-
186
-
187
-
188
-
189
-
190
-
191
-
192
-
 193
193 -
 194
194 -
 195
195 -
 196
196 -
 197
197 -
 198
198 -
 199
199 -
 200
200 -
 201
201 -
 202
202 -
 203
203 -
 204
204 -
 205
205 -
 206
206 -
 207
207 -
 208
208 -
 209
209 -
 210
210 -
 211
211 -
 212
212 -
 213
213 -
214
-
215
-
216
-
217
-
218
-
219
-
220
-
221
-
222
-
223
-
224
-
225
-
226
-
227
-
228
-
229
-
230
-
231
-
232
-
233
-
234
-
235
-
236
-
237
-
238
-
239
-
240
-
241
-
242
-
243
-
244
-
245
-
246
-
247
-
248
-
249
-
250
 |
 |

13 Sustainability statements 13.2.2 - 13.2.2
Annual Report 2013 203
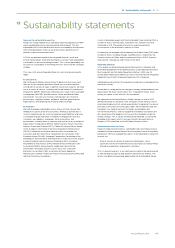
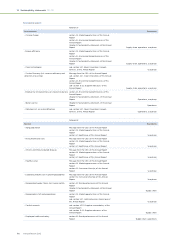
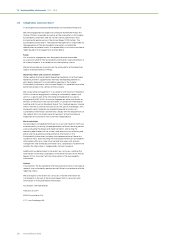
audits, compliance with all sections of the Declaration is reviewed. In the
event of non-compliance (NC) we require suppliers to make a corrective
action plan, and we monitor its implementation until all major NCs are
resolved. Full-scope audits are conducted in a 3-year cycle; to date we
have audited 90% of all identified risk suppliers.
Initial audit
(full scope)
3 year
cycle
Corrective action
implementation Supplier
training
&
capability
building
Continued
conformance audit
(full scope)
Resolution Audit
(limited scope)
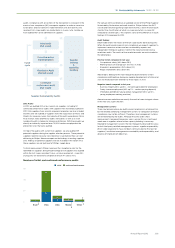
Supplier Sustainability Audits
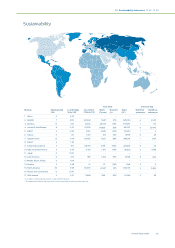
2013 Audits
In 2013 we audited 200 of our current risk suppliers, including 131
continued conformance audits with suppliers that we already audited in
2010. Risk suppliers from recently acquired companies are also included,
and this year we audited 27 suppliers from the acquisitions of Povos and
Preethi. As in previous years, the majority of the audits were done in China.
Also in Brazil, India and Mexico audits were done, as well as a small
number of audits in Indonesia, Ukraine and Vietnam. With these audits we
directly or indirectly impacted over 110,000 workers employed at the
production sites that were audited.
On top of the audits with current risk suppliers, we also audited 59
potential suppliers during the supplier selection process. These potential
suppliers need to close any zero-tolerance issues before they can start
delivering to Philips. Below we report on the findings at existing suppliers
only; findings at potential suppliers are not included in this report since
these suppliers are not (yet) part of Philips’ supply base.
To track improvements Philips measures the ‘compliance rate’ for the
identified risk suppliers, being the percentage of risk suppliers was audited
within the last 3 years and don’t have - or have resolved all - major NCs.
During 2013 we achieved a compliance rate of 77% (2012: 75%).
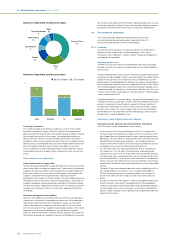
Number of initial and continued conformance audits
■-initial--■-continued conformance
150
100
50
0
3
7
Brazil
44
95
China
13
14
India
6
8
Mexico 3
7
Others
Per January 2013 we rolled out an updated version of the Philips Supplier
Sustainability Declaration and audit checklist. Philips follows the EICC
classification for distinguishing major and minor NCs, and in the new audit
checklist the classification of what is a major and what is a minor NC
changed for several topics. This explains some of the dierences in audit
findings 2013 compared to 2012.
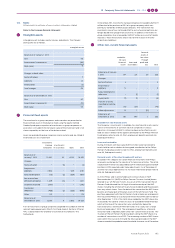
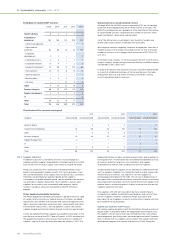
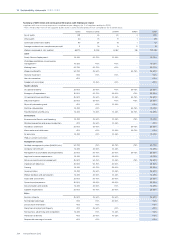
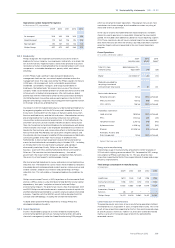
Audit findings
Below table shows the results of the full scope audits done during 2013.
When the audit reveals areas of non-compliance we request suppliers to
implement corrective actions and our sustainability experts and
independent third party auditors monitor the implementation during
resolution audits. The results of the resolution audits are not included in
the table below.
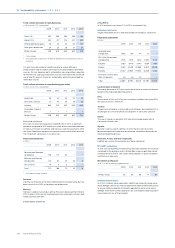
Positive trends compared to last year
• Occupational safety (NCs down 29%)
• Working hours (on average 22% less NCs in 2013)
• Emergency preparedness (NCs down 8%)
• Wages and benefits (NCs down 8%)
Above topics belong to the most frequently observed areas of non-
compliance and therefore, during our supplier development activities and
visits we have paid more attention to these topics in 2013.
Negative trends compared to last year
• Business integrity (NCs up 28% - no training provided for employees)
• Freely chosen employment (NCs up 11% - workers paying deposits)
• Child labor prohibition/young worker management (NCs up 10% -
young employees working overtime)
Above increases we believe are mostly the result of more stringent criteria
in the new EICC audit checklist.
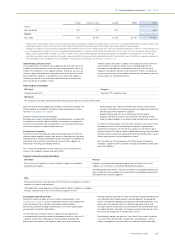
Management systems
There may be areas where our audits reveal compliance in actual practice,
but the related underlying management systems to safeguard continued
compliance may not be sufficient. Therefore, also management systems
are reviewed during the audits. Although the 2013 audits show
improvements compared to previous years, we see this as a continued
weak area at suppliers where further capacity building is necessary.
Related to management systems the most frequently observed NCs are a
lack of third-party certified management systems, supplier responsibility
(EICC Code requirements have not been communicated to the next tier
suppliers), insufficient management accountability and responsibility, and
absence of improvement objectives.